財務省は目論見通り円売りを潰した。そして、円買いの流れすら作った?
The MOF Crushed the Yen Shorts as Planned. Did It Also Create a Yen Bid?
8月7日の金曜に公表されたCFTC建玉報告※は、私たちが4日前に書いた記事の答え合わせでした。7月30日と31日の介入が、投機筋のポジションに何をしたのか。その最初の数字が、ようやく出てきました。
The CFTC Commitments of Traders report※ published on Friday, August 7 was a scorecard for the article we wrote four days earlier. What did the July 30 and 31 interventions actually do to speculative positioning? The first numbers have finally arrived.
※ CFTC建玉(たてぎょく)報告とは、米商品先物取引委員会が毎週金曜に公表する、シカゴ市場の先物ポジション統計のことです。火曜時点の残高が金曜に公表されるため、常に3日遅れの写真になります。
※ The CFTC Commitments of Traders report is a weekly statistical release from the U.S. Commodity Futures Trading Commission covering futures positions on the Chicago market. Balances as of Tuesday are published on Friday, so it is always a three-day-old photograph.
結論から書きます。投機筋のネット円ショートは、1週間で16.3万枚から4.5万枚へ、11.8万枚減りました。過去10年分の週次データ500週を並べても、これほど大きな1週間の縮小は一度もありません。文字通りの1位です。2位は2024年8月、あの円キャリー巻き戻しの週の6.2万枚ですから、今回はその1.9倍にあたります。しかも2024年は6週間かけて起きたことが、今回は1週間で起きました。
Let us start with the conclusion. Speculators' net yen short fell from 163,000 contracts to 45,000 in a single week, a reduction of 118,000. Across 500 weeks of data covering the past decade, there has never been a larger one-week reduction. It is literally number one. Second place is August 2024, the week of the famous yen carry unwind, at 62,000 contracts, so this move was 1.9 times as large. And what took six weeks in 2024 happened here in one.
ただ、この記事で書きたいのは「11.8万枚減った」という見出しではありません。
But the headline this article wants to write is not "118,000 contracts vanished."
この数字を受けて、市場では「円のショートは一掃された。もう踏み上げる相手がいないのだから、介入も一区切りだろう」という読みが広がっています。私たちは同じ報告の別の列を見て、ほぼ逆の結論に至りました。踏み上げる相手は、過去の介入時とほとんど同じだけ残っています。そして、もう一つ。ほとんど誰も触れていない数字が、円高への転換の入り口かもしれない形をしています。
In response to these numbers, a reading has spread through the market: the yen shorts have been wiped out, there is no one left to squeeze, so the intervention campaign has probably run its course. Looking at a different column of the same report, we reached almost the opposite conclusion. There are nearly as many traders left to squeeze as there were before past interventions. And there is one more thing: a number almost nobody has mentioned looks like it could be the entrance to a turn toward a stronger yen.
まず、何が起きたのか
First, What Happened
数字を並べます。
Here are the numbers.
| 週(火曜時点) | ネットポジション | 前週比 |
|---|---|---|
| 6月30日 | -15.5万枚 | -0.9万枚 |
| 7月14日 | -12.3万枚 | +0.1万枚 |
| 7月21日 | -15.2万枚 | -2.9万枚 |
| 7月28日(介入直前) | -16.3万枚 | -1.1万枚 |
| 8月4日(介入後) | -4.5万枚 | +11.8万枚 |
| Week (as of Tuesday) | Net position | Weekly change |
|---|---|---|
| June 30 | -155K contracts | -9K |
| July 14 | -123K | +1K |
| July 21 | -152K | -29K |
| July 28 (just before intervention) | -163K | -11K |
| August 4 (after intervention) | -45K | +118K |
介入直前の7月28日は、火曜です。財務省が最初の一撃を放った7月30日の、2営業日前でした。つまりこの報告は、介入前の満タンの状態と、介入後の状態を、ちょうど1週間の間隔で挟んで撮影しています。
July 28, the last reading before the intervention, was a Tuesday, two business days before the Ministry of Finance fired its first shot on July 30. In other words, this report photographs the fully loaded state before the intervention and the state afterwards, exactly one week apart.
金額に直すと分かりやすいかもしれません。円建先物1枚は1250万円ですから、1週間で消えた売り持ちはおよそ1.47兆円分です。残っているネットの売り持ちは0.57兆円分しかありません。
Converting to yen may make it clearer. One yen futures contract is 12.5 million yen, so roughly 1.47 trillion yen of short exposure disappeared in a week. Only about 0.57 trillion yen of net short exposure remains.
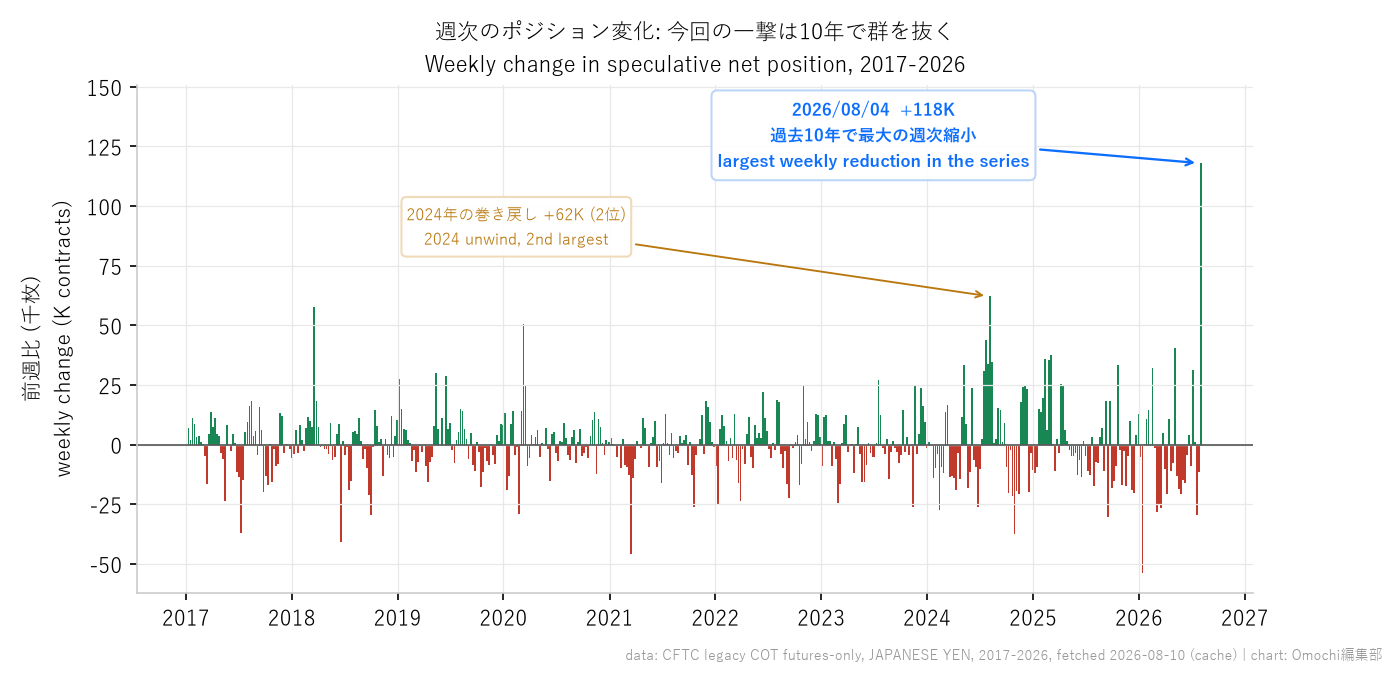
速度も測っておきます。この記事のもとになった問題意識は「変化の量だけでなく、変化の速さを見たい」というものでした。そこで前週比の、さらに前週比、つまり加速度を計算すると、今回は+12.9万枚で、これも500週中の1位です。直前の週(7月28日)はまだ売りが増えていた、つまり逆方向に進んでいた最中でした。減速して止まったのではなく、走っている最中に反対を向いた。そういう種類の転換です。
Let us also measure the speed. The question behind this article was to look not only at the size of the change but at its rate. Computing the change in the weekly change, that is, the acceleration, gives +129,000 contracts, which is also number one out of 500 weeks. In the immediately preceding week, July 28, shorts were still growing, meaning the position was moving in the opposite direction. It did not decelerate and stop; it turned around at full speed. That is the kind of inflection this was.
参考になるのが、同じ2026年の4月30日の介入です。同じ年、同じ当局、同じ投機筋を相手にした実験のようなものです。あのときはネットポジションの4割が消え、そこから12週間かけて、介入前より大きなショートに戻りました。今回消えたのはネットの7割で、変化量でいえば4月の2.9倍です。
A useful reference is the April 30 intervention of the same year, 2026, which works almost like a controlled experiment: same year, same authorities, same speculators. That time, 40 percent of the net position vanished, and over the following 12 weeks it rebuilt into a short larger than before the intervention. This time 70 percent of the net vanished, a change 2.9 times as large as April's.
ここまでの数字は、すべて「ネットポジション」の話です。断りを入れておくのは、この記事の後半で、同じ週を「ネット」ではない別の数字で見ると、まったく違う景色になるからです。4月の介入も、ネットでは4割が消えましたが、売り持ちそのものは18%しか減っていません。どちらも同じ週の、同じ市場の姿です。
Every figure so far refers to the net position. We flag this because later in the article, looking at the same weeks through a measure other than the net produces a completely different picture. In April, too, the net fell by 40 percent, but the gross short itself declined only 18 percent. Both describe the same week in the same market.
誰も見ていない「もう一つのポジション」
The Other Position Nobody Is Looking At
ここからが本題です。
Here is the heart of the matter.
ネットポジションは「買い持ち」から「売り持ち」を引いた差額です。差額が縮んだとき、原因は2つありえます。売り持ちが減ったのか、買い持ちが増えたのか。報道はほぼ例外なく前者、つまり「投機筋が投げた」「ショートが一掃された」という書き方をしています。
The net position is the long position minus the short position. When that difference shrinks, there are two possible causes: either shorts fell, or longs rose. Coverage has almost without exception assumed the former, writing that speculators capitulated or that the shorts were wiped out.
実際の内訳はこうでした。
Here is the actual breakdown.
| ポジション | 7月28日 | 8月4日 | 変化 |
|---|---|---|---|
| 買い持ち(ロング) | 10.1万枚 | 14.7万枚 | +4.6万枚(+45%) |
| 売り持ち(ショート) | 26.5万枚 | 19.3万枚 | -7.2万枚(-27%) |
| Position | July 28 | August 4 | Change |
|---|---|---|---|
| Long | 101K contracts | 147K | +46K (+45%) |
| Short | 265K | 193K | -72K (-27%) |
買い戻しが11.8万枚のうち61%、残る39%は新規の円買いです。そして、この+4.6万枚という1週間のロング積み増しは、過去500週で最大です。ここでも1位でした。買い持ちの残高14.7万枚は、10年間の分布のなかで91パーセンタイル。2026年の平均より29%多い水準です。
Short covering accounts for 61 percent of the 118,000 contract move; the remaining 39 percent is fresh yen buying. And that one-week addition of 46,000 long contracts is the largest in 500 weeks. Number one here as well. The resulting long balance of 147,000 contracts sits at the 91st percentile of the ten-year distribution, 29 percent above the 2026 average.
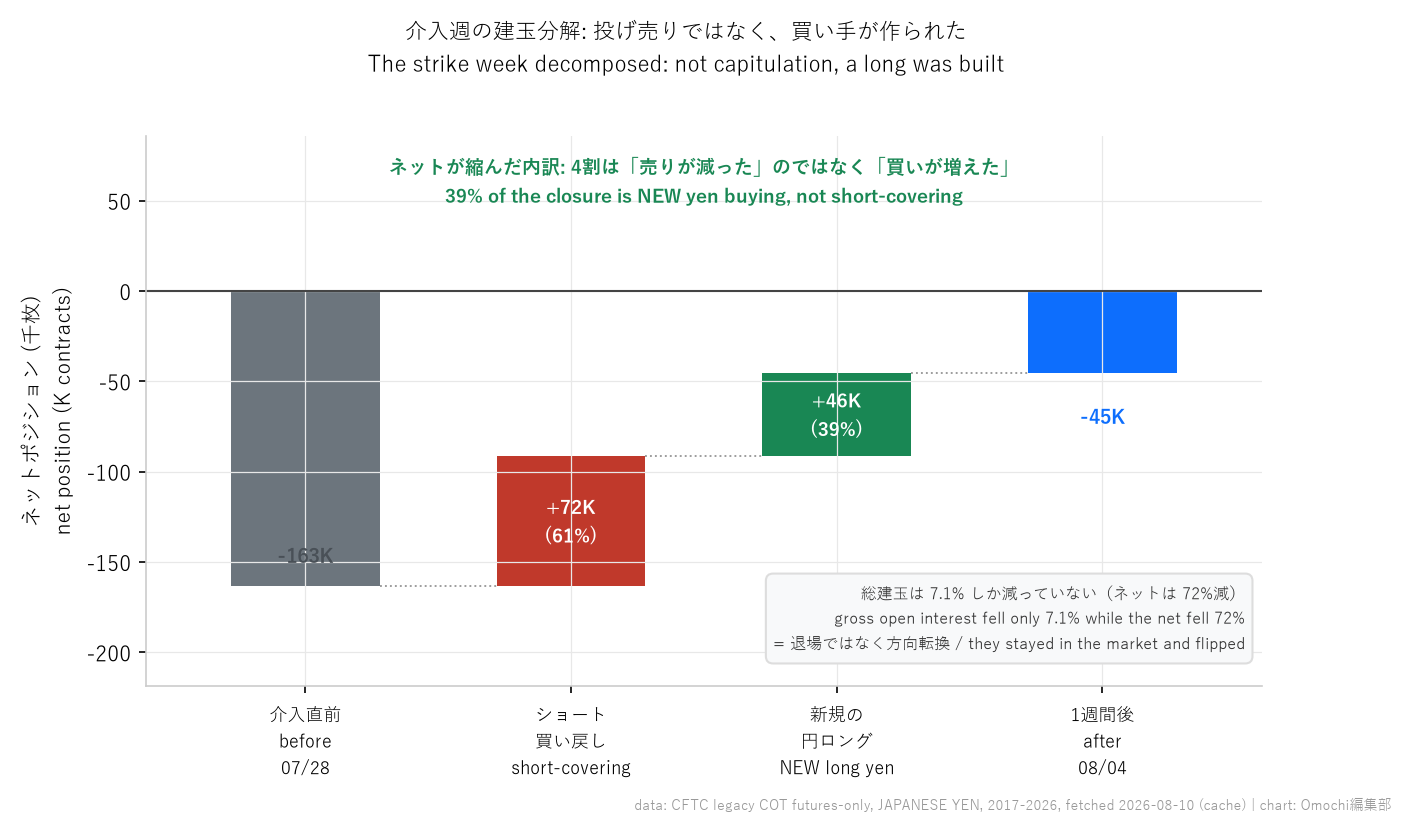
もう一つ、論点があります。買い持ちと売り持ちを足した「総建玉」は、この週に7.1%しか減っていません。ネットが72%縮んだのに、です。もし本当に投げ売りと退場が起きたのなら、総建玉も一緒に潰れるはずです。そうならなかったということは、参加者の多くは市場から降りたのではなく、市場に残ったまま向きを変えた、と読むのが自然です。
There is a further point. Gross open interest, longs plus shorts, fell only 7.1 percent that week, even though the net contracted 72 percent. If there had genuinely been panic selling and an exodus, gross would have collapsed too. That it did not suggests the natural reading: most participants did not leave the market, they stayed and changed direction.
介入は円売りを消しただけではありません。円買いを作ったのです。
The intervention did not merely erase yen selling. It created yen buying.
なぜ、それが重要なのか
Why That Matters
売りを潰すのと、買いを作るのとでは、次に起きることが違います。
Crushing sellers and creating buyers lead to different things next.
ショートの踏み上げ※は一度きりのイベントです。買い戻しが終われば、その買いはもう出てきません。ところが新しく作られた買い持ちは、そこに残ります。次に当局が円を買えば、その人たちは踏み上げられる側ではなく、利益を受け取る側です。当局と同じ方向を向いた参加者が市場のなかに増えたということは、次の介入の意味が変わるということです。痛めつける相手を探す作業から、味方に配当を払う作業に近づいていきます。
A short squeeze※ is a one-time event. Once the covering is done, that buying does not come back. Newly established long positions, by contrast, stay where they are. If the authorities buy yen again, those holders are not the ones being squeezed; they are the ones collecting. More participants facing the same direction as the authorities means the meaning of the next intervention changes. It moves from hunting for someone to hurt toward paying a dividend to allies.
※ 踏み上げとは、売り持ちの投資家が損失を抑えるために買い戻しを迫られ、その買いがさらに値段を押し上げる連鎖のことです。
※ A short squeeze is a chain reaction in which investors holding short positions are forced to buy back to limit losses, and that buying pushes the price up further.
この見立てには、当然ながら反証を当てておく必要があります。2024年の記録を見ると、話はそれほど単純ではありませんでした。あのときも巻き戻しのあとに買い持ちは増え続け、8月の6.4万枚から9月末には10.5万枚まで積み上がっています。買い持ちは確かに居座りました。しかし相場を決めたのはそちらではなく、戻ってきた売り持ちのほうでした。売り持ちは8月6日の7.8万枚から11月12日には12.9万枚へ、3カ月で1.66倍に再建され、ドル円は144円から153円へ戻っています。
This view naturally has to be tested against counterevidence. The 2024 record shows it is not so simple. Back then, too, longs kept rising after the unwind, building from 64,000 contracts in August to 105,000 by the end of September. Longs did indeed stay put. But what determined the market was not them; it was the shorts coming back. Shorts rebuilt from 78,000 on August 6 to 129,000 by November 12, a factor of 1.66 in three months, and dollar-yen retraced from 144 to 153.
つまり「買い手が作られたから円高が続く」とは、歴史は言っていません。買い手は残るが、売り手の再建に押し切られる、というのが2024年の答えでした。
So history does not say that a stronger yen persists simply because buyers were created. Buyers remain, but the rebuilding sellers overwhelm them. That was 2024's answer.
ただ、今回はその前提が違います。
This time, however, the starting conditions differ.
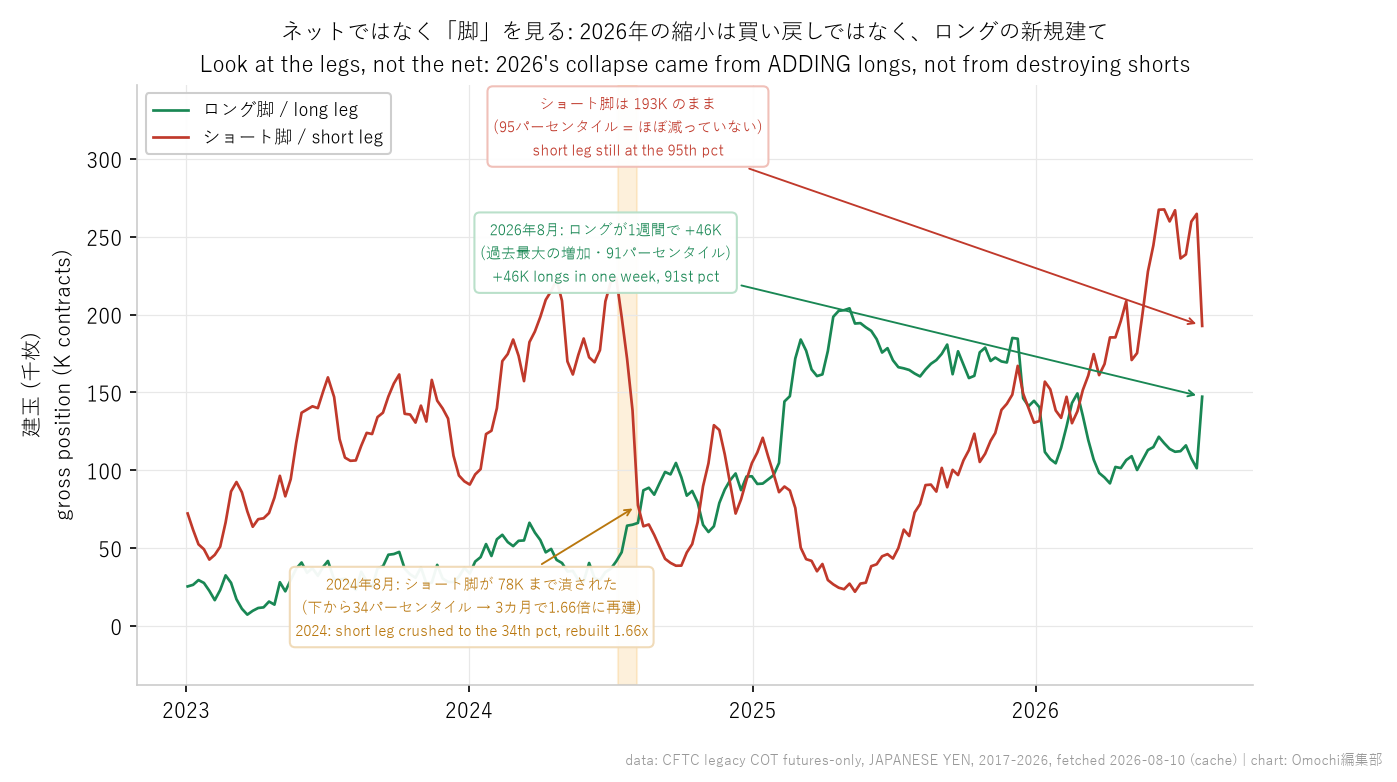
2024年8月の底で、売り持ちの残高は7.8万枚まで潰れていました。ピークの22.4万枚から、実に65%が消えた計算です。今回はどうでしょうか。売り持ちは26.5万枚から19.3万枚へ、27%しか減っていません。同じ「ネットが縮んだ」という見出しでも、2024年は売り持ちの一掃、今回は部分的な整理という違いがあります。
At the August 2024 trough, the short balance had been crushed to 78,000 contracts. From a peak of 224,000, fully 65 percent had vanished. What about this time? Shorts went from 265,000 to 193,000, a decline of only 27 percent. Under the same headline that the net shrank, 2024 was a clean-out of shorts while this time was a partial tidying up.
ここで一つ、注意しておきたいことがあります。「売り持ちがこれだけ残っているのだから、これ以上ショートが積み上がる余地は小さいのではないか」と考えたくなります。私たちも最初はそう考えました。ただ、過去のデータを当たると、そうは言えませんでした。2017年以降の売り持ちの底を30局面拾って、「どれだけ売り持ちが残ったか」と「その後13週間でどれだけ再建されたか」の関係を測ると、相関はほぼゼロです。むしろ同じ2026年の4月、あのときは17.1万枚も売り持ちが残った状態から、6週間で9.7万枚も積み増されています。2024年(7.8万枚しか残らなかった局面)の再建幅5.1万枚より大きい。売り持ちの残高は、追加のショートを妨げる天井にはなっていないのです。実際、2026年6月には26.8万枚という過去最大の売り持ちが記録されています。上限は、少なくともまだ見えていません。
One caution is worth raising here. It is tempting to think that with this many shorts still outstanding, there is little room for shorts to build further. We thought so at first too. But checking the historical data, that does not hold. Taking 30 troughs in the short leg since 2017 and measuring the relationship between how many shorts remained and how much rebuilding followed over the next 13 weeks, the correlation is essentially zero. If anything, April 2026 left 171,000 shorts outstanding and then added 97,000 more within six weeks, a larger rebuild than the 51,000 that followed 2024's trough, where only 78,000 remained. The outstanding short balance is not a ceiling that prevents additional shorts. Indeed, June 2026 recorded an all-time high short of 268,000 contracts. No upper limit is visible yet.
では、19.3万枚が残っていることに意味はないのかというと、そうではありません。ただしそれは「ショートが増えにくい」という意味ではなく、まったく別の意味を持ちます。次の章がその話です。
Does that mean the remaining 193,000 contracts are meaningless? Not at all. But their significance is not that shorts cannot grow; it is something entirely different. That is the subject of the next section.
財務省が撃ってきたのは、いつも「傾いた」相場だった
The MOF Has Always Fired Into a Lopsided Market
ここで、次の介入の話に移ります。
Now we turn to the next intervention.
過去の円買い介入について、その直前のポジションを並べてみました。上下2段になっているのは、この章の後半で説明する理由から、同じ7回を2つの物差しで測っているためです。まずは上段、報道が引用する「ネット」から見ていきます。
We lined up the positioning immediately before each past yen-buying intervention. It comes in two panels because, for reasons explained later in this section, we measure the same seven strikes two ways. Start with the top panel, the net figure the press quotes.
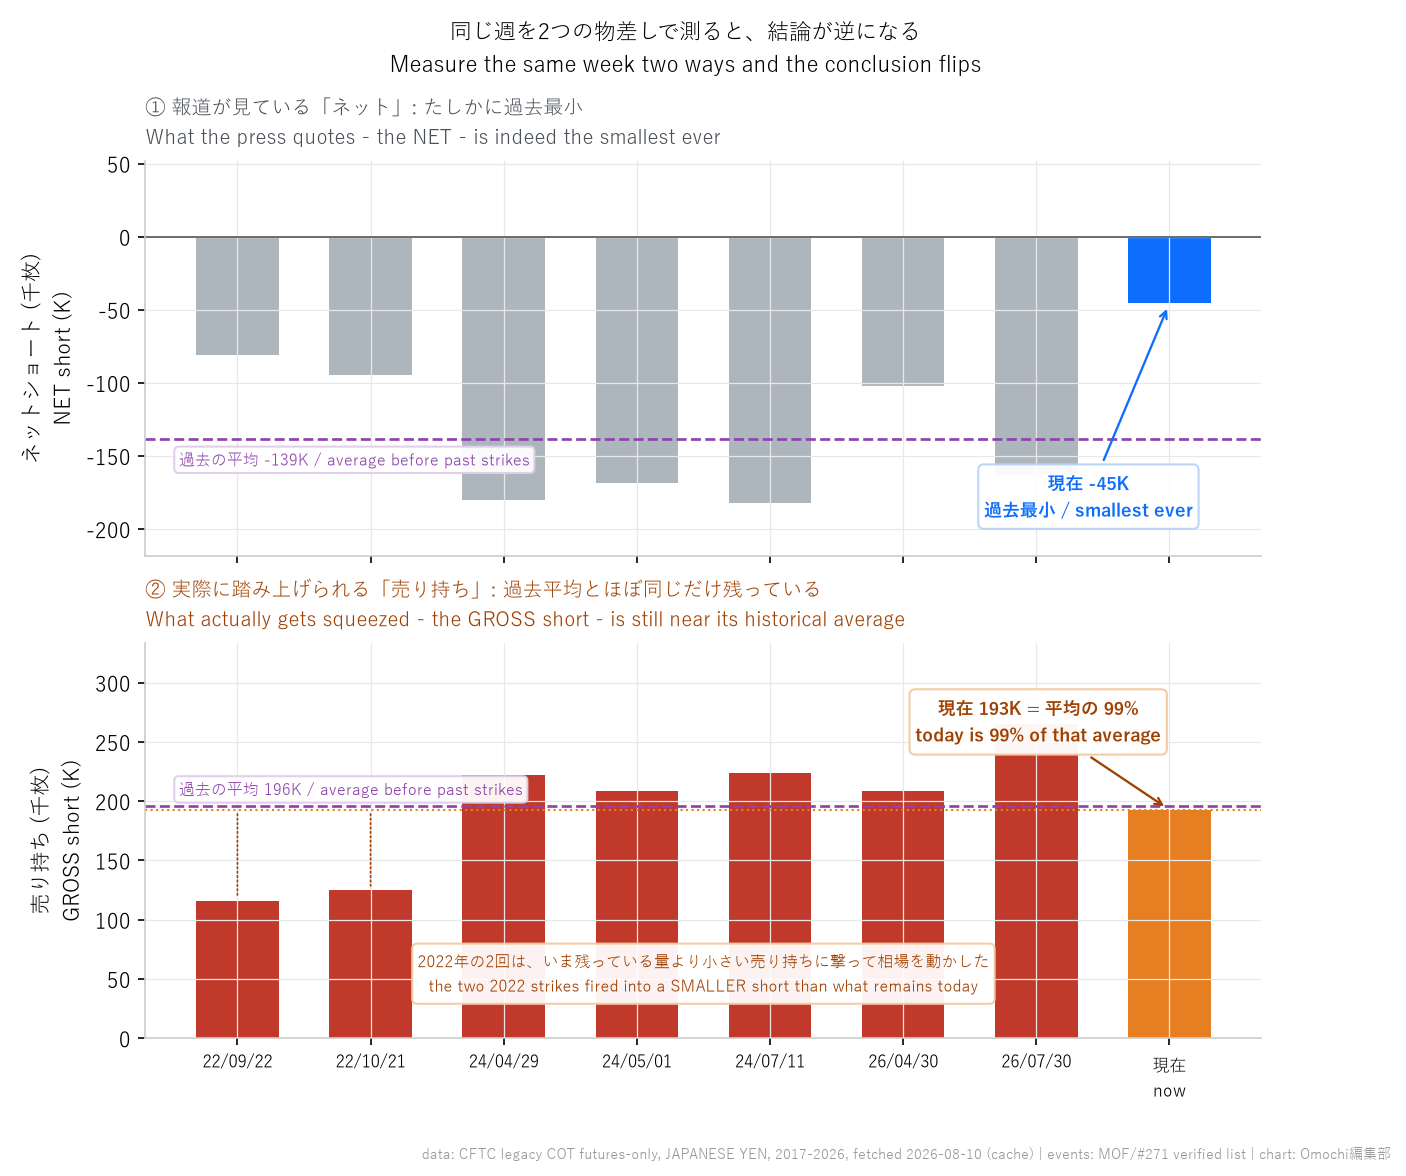
いずれもネットポジションです。2022年9月は-8.1万枚、10月は-9.4万枚。2024年4月は-18.0万枚、5月は-16.8万枚、7月は-18.2万枚。2026年4月は-10.2万枚、そして7月は-16.3万枚。平均すると-13.9万枚です。
All figures are net positions. September 2022 was -81K contracts and October -94K. April 2024 was -180K, May -168K, July -182K. April 2026 was -102K and July -163K. The average is -139K.
現在は-4.5万枚。平均の33%にすぎません。これまで財務省が撃ったなかで最も小さかったのは2022年9月の-8.1万枚ですが、それよりもさらに3.6万枚小さい水準です。
Today it is -45K, just 33 percent of that average. The smallest position the MOF has ever fired into was September 2022's -81K, and today is 36,000 contracts smaller still.
言い換えると、財務省はこれほど空いたポジションに向けて介入したことが、一度もありません。
Put differently, the MOF has never once intervened against a position this empty.
ただし、ここで測り方を一つ間違えると、結論を取り違えます。
But get the measurement wrong here and you will get the conclusion wrong.
いま並べたのは「ネット」の数字です。ネットは買い持ちと売り持ちの差額ですから、買い持ちが増えれば、売り持ちが1枚も減らなくても縮みます。ところが、介入で踏み上げられて痛むのは、ネットを持っている誰かではありません。売り持ちを抱えている人です。円を買っている人が横にいても、円を売っている人の損失は1円も和らぎません。別々の建玉、別々の参加者です。
The figures above are net. Since the net is longs minus shorts, it shrinks when longs increase even if not a single short contract is closed. But the person who gets squeezed and hurt by an intervention is not someone holding a net figure. It is the person holding the short. Having a yen buyer standing next to them does not soften a yen seller's loss by a single yen. Different books, different participants.
そこで、同じ7回の介入について、直前の「売り持ちそのもの」を並べ直してみました。先ほどの図の下段が、それにあたります。
So we relisted the same seven interventions by the gross short immediately preceding each. That is the lower panel of the figure above.
| 介入 | 直前の売り持ち |
|---|---|
| 2022年9月 | 11.6万枚 |
| 2022年10月 | 12.5万枚 |
| 2024年4月 | 22.2万枚 |
| 2024年5月 | 20.9万枚 |
| 2024年7月 | 22.4万枚 |
| 2026年4月 | 20.9万枚 |
| 2026年7月 | 26.5万枚 |
| 現在 | 19.3万枚 |
| Intervention | Gross short just before |
|---|---|
| September 2022 | 116K contracts |
| October 2022 | 125K |
| April 2024 | 222K |
| May 2024 | 209K |
| July 2024 | 224K |
| April 2026 | 209K |
| July 2026 | 265K |
| Today | 193K |
過去7回の平均は19.6万枚。現在の19.3万枚は、その99%にあたります。しかも2022年の2回、財務省は11.6万枚と12.5万枚という、いま残っている量より少ない売り持ちに向けて介入し、相場を動かしています。
The average across those seven is 196,000 contracts. Today's 193,000 is 99 percent of that. Moreover, on two occasions in 2022 the MOF intervened against gross shorts of 116,000 and 125,000, smaller than what remains outstanding right now, and moved the market.
つまり、踏み上げる相手は十分に残っています。ネットの傾きは確かに消えましたが、「撃つ的がなくなった」わけではありません。的は、過去の平均とほぼ同じ大きさで、そこにあります。
In other words, there are plenty of traders left to squeeze. The net tilt has indeed disappeared, but that does not mean the target is gone. The target is sitting there, at roughly the same size as the historical average.
ここは慎重に書きます。これは「もう介入はない」という意味でも、「次も9円動く」という意味でもありません。介入には水準を守る目的や、意思を示す目的もあります。7日に片山財務相は、米国と「緊密に連絡を取っている」と述べ、必要なら「ためらわない」と改めて明言しました。ベッセント米財務長官も協調介入への参加に「ためらわない」と述べています。実弾が出る条件は揃っています。
Let us be careful here. This does not mean there will be no more intervention, nor that the next one will move the market nine yen again. Intervention also serves to defend levels and to signal resolve. On August 7, Finance Minister Katayama said Japan was in close communication with the United States and reiterated that it would not hesitate if necessary. U.S. Treasury Secretary Bessent has likewise said he would not hesitate to participate in further joint intervention. The conditions for live ammunition are in place.
変わったのは、介入の「効き方」のほうです。7月30日の一撃は、記録的に混雑したネットのショートを踏み上げました。あの形での一撃は、ネットが整理された以上、同じようには再現しにくい。しかし売り持ち自体は平均並みに残っていますから、次に撃てば、やはり痛む人はいます。そして今回はその横に、14.7万枚の買い持ちが待っています。
What has changed is how an intervention works. The July 30 strike squeezed a record-crowded net short. With the net now tidied up, a strike of that exact shape is hard to reproduce. But the gross short itself remains near average, so if they fire again, there will still be people who get hurt. And this time, standing beside them, 147,000 long contracts are waiting.
なお、正確を期すために付け加えると、今回の介入額はまだ公式には確定していません。財務省が7月31日に公表した月次実績は「6月29日から7月29日」が対象期間で、金額はゼロ。介入の前日で締まっているのです。7月30日と31日の分が公表されるのは8月末で、それまで市場が語る「8.45兆円」はすべて日銀当座預金からの推計値です。史上最大の介入は、公式の帳簿の上では、まだ存在していません。
For the sake of precision, we should add that the size of this intervention has not been officially confirmed. The monthly figure the MOF published on July 31 covers June 29 through July 29 and reports zero. The window closed the day before the intervention. The July 30 and 31 operations will be published at the end of August, and until then every "8.45 trillion yen" the market cites is an estimate derived from Bank of Japan current account data. The largest intervention in history does not yet exist in the official ledger.
調達通貨はフランへ移ったのか
Did the Funding Currency Move to the Franc?
4日前の記事で、私たちはもう一つの見立てを書きました。円の金利がスイスフランを上回った以上、キャリートレード※の調達通貨は円からフランへ移りつつある、という話です。ING(7月28日付)やマネックス証券のコラムを引きました。
In our article four days ago we advanced another view: now that Japanese rates exceed Swiss ones, the funding currency for carry trades※ is shifting from the yen to the franc. We cited ING, dated July 28, and a Monex Securities column.
※ キャリートレードとは、金利の低い通貨で資金を調達し、金利の高い資産に投資して差額を得る取引のことです。調達側の通貨は売られやすくなります。
※ A carry trade is a strategy of borrowing in a low-interest-rate currency and investing in higher-yielding assets to capture the spread. The funding currency tends to be sold.
同じCFTC報告でフランのポジションも確認しました。結果はこうです。
We checked the franc's positioning in the same CFTC report. Here is the result.
| 通貨 | 7月28日 | 8月4日 | 変化 | 元のポジション比 |
|---|---|---|---|---|
| 円 | -16.3万枚 | -4.5万枚 | +11.8万枚 | 72% |
| ユーロ | -7.2万枚 | -5.8万枚 | +1.4万枚 | 20% |
| ポンド | -6.5万枚 | -5.8万枚 | +0.7万枚 | 11% |
| スイスフラン | -3.35万枚 | -3.28万枚 | +640枚 | 2% |
| Currency | July 28 | August 4 | Change | Share of prior position |
|---|---|---|---|---|
| Yen | -163K | -45K | +118K | 72% |
| Euro | -72K | -58K | +14K | 20% |
| Pound | -65K | -58K | +7K | 11% |
| Swiss franc | -33.5K | -32.8K | +640 contracts | 2% |
円のショートが記録的に減った週に、フランのショートはほとんど動いていません。+640枚という変化は、フラン自身の週次変動の0.19シグマ、静かなほうから17%に入る大きさです。円が動いた量の、絶対値で見て8分の1以下です。
In the week the yen short posted a record decline, the franc short barely moved. That change of 640 contracts is 0.19 standard deviations of the franc's own weekly variation, placing it among the quietest 17 percent of its weekly moves. In absolute terms it is less than one eighth of the yen's move.
もし「円を売る代わりにフランを売る」という乗り換えがこの週に起きたのなら、フランのショートは数万枚単位で増えていたはずです。増えていません。
If a switch from selling yen to selling francs had occurred that week, the franc short should have grown by tens of thousands of contracts. It did not.
では見立てが間違っていたのかというと、データはもう少し面白いことを言っています。年ごとに、フランのショートが3万枚を超えた週が何週あったかを数えてみました。
Does that mean our view was wrong? The data says something more interesting. We counted, year by year, how many weeks the franc short exceeded 30,000 contracts.
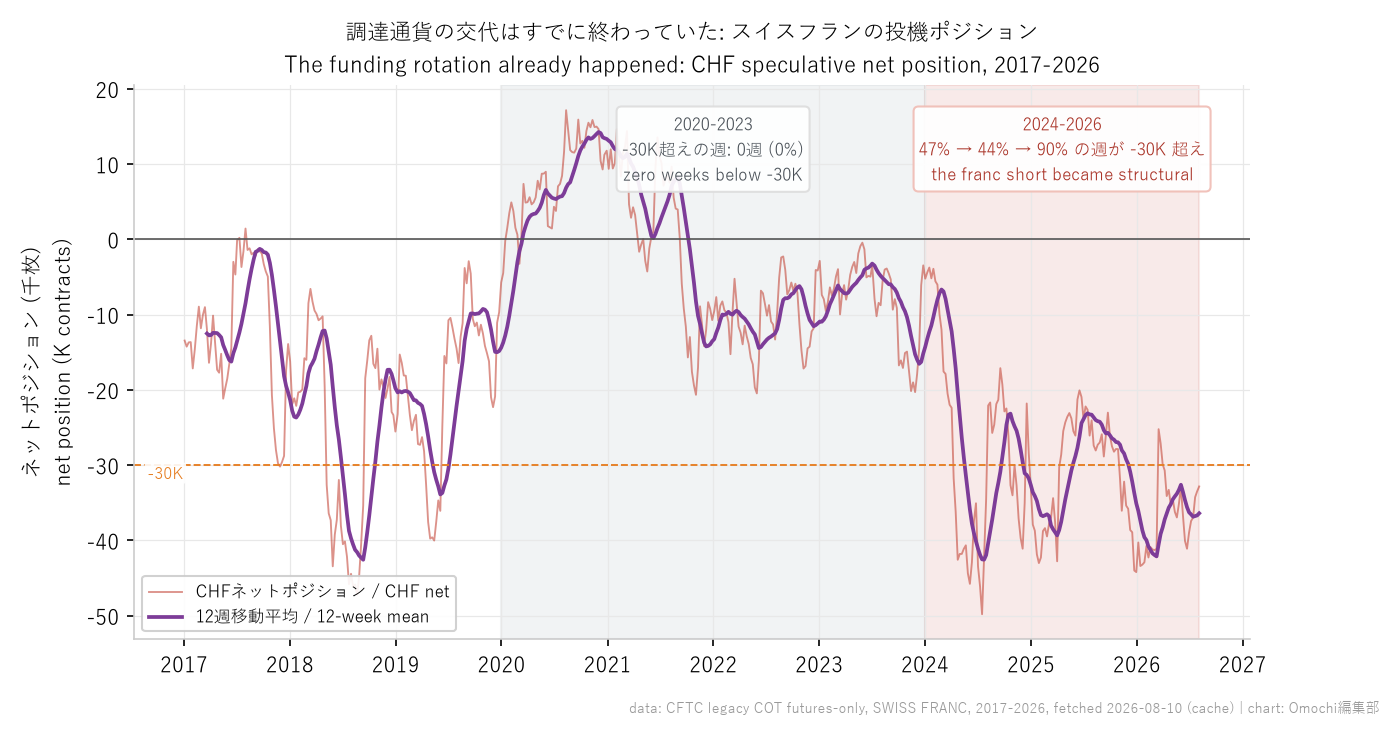
2020年から2023年までの4年間、その週は一度もありません。ゼロです。ところが2024年は53週中25週(47%)、2025年は52週中23週(44%)、そして2026年はここまで31週中28週、実に90%がその水準を超えています。2017年から2023年の平均が-0.95万枚だったのに対し、2024年以降の平均は-3.10万枚。225%深いショートが常態になりました。
Across the four years from 2020 to 2023, there was not a single such week. Zero. But in 2024 it was 25 of 53 weeks (47 percent), in 2025 23 of 52 (44 percent), and in 2026 so far 28 of 31 weeks, fully 90 percent, exceeded that level. Against an average of -9.5K contracts from 2017 to 2023, the average since 2024 is -31.0K. A short 225 percent deeper has become the norm.
つまり、調達通貨の交代は本当に起きています。ただし今週ではなく、2024年に起きていたのです。
So the changing of the funding currency really is happening. It just happened in 2024, not this week.
これは私たちの見立ての方向が正しく、時制が間違っていたということです。フランへの乗り換えはすでにほぼ完了していた。だから介入の週に、乗り換える余地がもう残っていなかった。フランのショートが動かなかったのは、鈍感だったからではなく、すでに満杯だったからです。
Our view had the direction right and the tense wrong. The shift into the franc was already largely complete, which is why there was no room left to rotate during the intervention week. The franc short did not move not because it was insensitive, but because it was already full.
独立した傍証もあります。Bloombergは8月5日、新興国通貨のキャリー指数が今回の介入後に1%しか下がっていないと報じました。2024年8月の巻き戻しでは4%下げた指数です。同記事はその理由を「調達通貨がすでに分散していたから」と説明しています。私たちがCFTCの建玉から見ているものと、同じ結論です。そしてINGがフラン調達を推したのは7月28日、介入の2営業日前でした。介入が乗り換えを引き起こしたのではなく、乗り換えはもう終わっていたのです。
There is independent corroboration. On August 5, Bloomberg reported that its emerging-market carry index fell only about 1 percent after this intervention, against roughly 4 percent during the August 2024 unwind, explaining that funding currencies had already diversified. That is the same conclusion we reach from CFTC positioning. And ING recommended franc funding on July 28, two business days before the intervention. The intervention did not cause the rotation; the rotation was already finished.
ここに一つの非対称があります。財務省は円のネットショートを、1週間で7割まで縮めることができました。しかし、その円の代わりに調達通貨になったフランのポジションには、手が届きません。スイス国立銀行の政策金利は0.00%で、報道によれば2027年末まで据え置きの見通しです。フラン安はスイスにとって困ることではありません。介入は目の前のドル円の動きには効いていますが、円が調達通貨の座から降りたという構造そのものは既に出来上がっていた、ということになります。
There is an asymmetry here. The MOF was able to shrink the yen's net short by 70 percent in a week. But it cannot reach the franc positioning that replaced the yen as a funding currency. The Swiss National Bank's policy rate is 0.00 percent and, according to reports, is expected to stay there through the end of 2027. A weaker franc is not a problem for Switzerland. Intervention works on the immediate move in dollar-yen, but the structural fact that the yen has stepped down from its role as a funding currency was already in place.
編集部の見立て
Our View
今回の報告から読み取れることを、3つに整理します。そしてこの3つは、いま流れている「常識」とはかなり違う絵を描きます。
We organize what this report tells us into three points. Together they paint a picture quite different from the conventional wisdom now circulating.
第一に、7月30日と31日の介入は、当局の目的に照らせば成功でした。ネットの円ショートを1週間で7割消し、売り持ちそのものも7.2万枚減らしています。どちらも過去500週で最大の縮小です。「投機筋に痛打を与える」という7月にReutersが報じた教義は、データの上で実行されています。
First, judged against the authorities' own objective, the July 30 and 31 interventions were a success. They erased 70 percent of the net yen short in a week and cut the gross short by 72,000 contracts. Both are the largest reductions in 500 weeks. The doctrine Reuters reported in July, that the aim was to inflict serious pain on speculators, has been carried out in the data.
第二に、ここが本題です。今回の報告を受けた市場の解説は、おおむね「円のショートは一掃された」「もう踏み上げる相手がいないのだから、これ以上介入する理由も乏しい」という方向に傾いています。しかしその読みは、ネットポジションという一つの数字だけを見た結論です。
Second, and this is the crux. Market commentary following this report has largely leaned toward the view that the yen shorts have been wiped out, that there is no one left to squeeze, and therefore little reason for further intervention. But that reading is a conclusion drawn from a single number, the net position.
ネットが4.5万枚まで縮んだのは事実です。過去のどの介入直前よりも小さい。ただし繰り返しになりますが、ネットが縮んだ主因は買い持ちが4.6万枚増えたことであって、売り持ちが消えたことではありません。そして介入で踏み上げられて損をするのは、ネットを持つ誰かではなく、売り持ちを抱えた人です。
It is true that the net shrank to 45,000 contracts, smaller than before any prior intervention. But to repeat, the main reason the net shrank is that longs grew by 46,000, not that shorts disappeared. And the party squeezed into a loss by intervention is not someone holding a net figure, but someone holding a short.
その売り持ちは、19.3万枚残っています。過去7回の介入直前の平均は19.6万枚ですから、その99%。2022年に財務省が相場を動かした2回の介入は、11.6万枚と12.5万枚という、いま残っている量より少ない売り持ちが相手でした。
That short still stands at 193,000 contracts. The average before the past seven interventions was 196,000, so today is 99 percent of it. The two 2022 interventions with which the MOF moved the market faced gross shorts of 116,000 and 125,000, smaller than what remains today.
つまり「もう撃つ相手がいない」という前提そのものが、測る数字を間違えています。踏み上げられる相手は、過去の介入時とほぼ同じだけ、そこにいます。お盆の薄商いという窓は開いたままで、的も残っている。介入の可能性を減らす材料は、少なくともポジションの側からは見当たりません。
In short, the premise that there is no one left to shoot at is measuring the wrong number. There are about as many squeezable participants as there were before past interventions. The window of thin Obon holiday liquidity is still open, and the target is still there. From the positioning side at least, we see nothing that reduces the odds of intervention.
そして、この原稿を書いている8月10日の時点で、ドル円は158.1円と、200日移動平均線の158.05円をわずかに上抜けてきています。介入前の163円台とはまだ5円の距離がありますから、当局がすぐ動く水準とは言えません。ただ、方向は戻る側を向いていて、撃つ相手も残っていて、市場はお盆で薄い。少なくとも「もう終わった」と言い切れる状態ではありません。
As of August 10, when this piece is being written, dollar-yen sits at 158.1, slightly above the 200-day moving average at 158.05. It is still five yen away from the 163 handle that preceded the intervention, so this is not a level at which the authorities would act immediately. But the direction is pointing back, the targets remain, and the market is thin for Obon. This is not a state anyone can confidently call finished.
第三に、そしてこれが今回いちばん重要な変化ですが、介入は売り手を減らしただけでなく、買い手を作りました。1週間で4.6万枚という、過去500週で最大の円買いポジションが新規に組まれています。
Third, and this is the most important change this time, the intervention did not only reduce sellers. It created buyers. In one week, 46,000 contracts of fresh long-yen positions were established, the largest such build in 500 weeks.
この数字が効いてくるのは、直前の動きと並べたときです。買い持ちは介入前の5週間、12.2万枚から10.1万枚へ、じりじりと減り続けていました。円を買う人は減っていたのです。それが介入をはさんだ1週間で14.7万枚へ跳ねた。流れが細っていたところに、方向転換が入ったという形をしています。
This number lands hardest when set against what came just before. For the five weeks preceding the intervention, longs had been grinding lower, from 122,000 to 101,000 contracts. Yen buyers were disappearing. Then, across the intervention week, the figure jumped to 147,000. The flow had been thinning, and then it turned.
ここに循環が生まれます。売り持ちは平均並みに残っている。だから次に撃てば、やはり誰かが踏み上げられる。踏み上げられた分は、買い持ちを抱えている人の利益になる。当局と同じ側に立つことが儲かるとわかれば、売り持ちから買い持ちへ乗り換える動機はさらに強まる。
A loop emerges here. The gross short remains near average, so if they fire again, someone still gets squeezed. What is squeezed out becomes profit for those holding longs. Once standing on the same side as the authorities is seen to pay, the incentive to switch from short to long strengthens further.
この循環が実在するのかは、過去の記録で確かめられます。円買い介入のあと13週間で、買い持ちがどうなったかを並べました。
Whether this loop is real can be checked against the historical record. Here is what happened to longs in the 13 weeks after each yen-buying intervention.
| 介入 | 直前の買い持ち | 13週後のピーク | 倍率 |
|---|---|---|---|
| 2022年9月 | 3.5万枚 | 4.0万枚 | 1.16倍 |
| 2022年10月 | 3.1万枚 | 4.0万枚 | 1.32倍 |
| 2024年4月 | 4.2万枚 | 6.4万枚 | 1.52倍 |
| 2024年7月 | 4.2万枚 | 10.5万枚 | 2.52倍 |
| 2026年4月 | 10.7万枚 | 12.2万枚 | 1.14倍 |
| 2026年7月 | 10.1万枚 | 14.7万枚(1週目で) | 1.45倍 |
| Intervention | Longs just before | Peak within 13 weeks | Multiple |
|---|---|---|---|
| September 2022 | 35K contracts | 40K | 1.16x |
| October 2022 | 31K | 40K | 1.32x |
| April 2024 | 42K | 64K | 1.52x |
| July 2024 | 42K | 105K | 2.52x |
| April 2026 | 107K | 122K | 1.14x |
| July 2026 | 101K | 147K (in week one) | 1.45x |
過去5回、例外なく買い持ちは増えています。そして今回が過去と違うのは速さです。これまでは介入のあと数週間かけて積み上がったものが、今回は最初の1週間で14.7万枚に達しました。2024年7月の13週後のピーク10.5万枚さえ、すでに上回っています。
In all five prior cases, without exception, longs increased. What differs this time is the speed. Where past builds accumulated over several weeks after an intervention, this one reached 147,000 contracts in the first week alone. That already exceeds even the 105,000 peak reached 13 weeks after July 2024.
3つを重ねると、市場の常識とはかなり違う絵になります。「ショートが一掃されたので介入は終わり」ではなく、踏み上げる相手は過去の平均並みに残っていて、しかもその横に、当局と同じ方向を向いた買い手が過去最速で積み上がりつつある。次の一撃があれば、痛む人と儲かる人が同時に生まれ、後者が増えるほど乗り換えの動機は強まります。トレンドの転換点は、たいていこういう形をしています。
Stack the three together and the picture differs sharply from the market consensus. Rather than "the shorts were wiped out so intervention is over," there are as many squeezable participants left as before past strikes, and beside them, buyers facing the same way as the authorities are accumulating at record speed. If another strike comes, it creates losers and winners simultaneously, and the more the latter grow, the stronger the incentive to switch. Trend turning points usually look something like this.
ただし、ここは正直に線を引いておきます。買い持ちの跳ね上がりは、まだ1週分のデータです。過去5回はいずれも増えたとはいえ、今回それが続くかどうかは、8月14日の次の報告を見るまで分かりません。そして2024年の教訓も残っています。あのときも買い持ちは居座りましたが、相場を決めたのは戻ってきた売り持ちのほうでした。
That said, let us draw an honest line. The jump in longs is still only one week of data. Although all five prior cases saw increases, whether it continues this time cannot be known until the next report on August 14. And the 2024 lesson still stands: back then, too, longs stayed put, but what determined the market was the shorts coming back.
円高が続くかどうかを最後に決めるのは、ポジションではなく日米の金利差です。日銀は7月31日に1.00%で据え置きましたが、8対1の採決で、高田創委員が1.25%への利上げを主張して反対票を投じています。9月会合は生きています。BofAは年末のドル円見通しを152円から149円へ引き下げ、「介入の成功には金融政策の追随が要る」と付け加えました。ポジションが整った相場を最後に動かすのは、いつも金利です。
What ultimately decides whether yen strength persists is not positioning but the Japan-U.S. interest rate gap. The Bank of Japan held at 1.00 percent on July 31, but on an 8-1 vote, with board member Hajime Takata dissenting in favor of a hike to 1.25 percent. The September meeting is live. Bank of America cut its year-end dollar-yen forecast from 152 to 149, adding that a successful intervention requires follow-through from macroeconomic policy. What finally moves a market with tidy positioning is always rates.
言えるのはこういうことです。ポジションの側は、円高への転換を否定していません。むしろ、その入り口に見える形をしています。あとは金利がそれを裏付けるかどうか。9月の日銀会合までに、答えの半分は出ます。
Here is what can be said. The positioning data does not rule out a turn toward a stronger yen. If anything, it looks like the entrance to one. What remains is whether rates confirm it. Half the answer will arrive by the September Bank of Japan meeting.
当面の確認事項を並べておきます。
Here is what to watch in the near term.
| 日付 | 何が出るか | 見るポイント |
|---|---|---|
| 8月14日(金) | 次のCFTC建玉報告(11日火曜時点) | 買い持ちが維持されたか、売り持ちが戻り始めたか |
| 8月末 | 財務省の月次介入実績 | 7月30日・31日の公式金額が初めて判明 |
| 9月会合 | 日銀金融政策決定会合 | 利上げがあれば、介入の効果に金利の裏付けが付く |
| 随時 | ドル円200日移動平均線 158.05円 | 執筆時点で158.1円と、わずかに上抜け。定着するかどうか |
| Date | What is released | What to watch |
|---|---|---|
| Friday, August 14 | Next CFTC positioning report (as of Tuesday the 11th) | Whether longs held, and whether shorts began rebuilding |
| End of August | MOF monthly intervention figures | The first official amount for July 30 and 31 |
| September meeting | Bank of Japan policy meeting | A hike would give the intervention rate-differential backing |
| Ongoing | Dollar-yen 200-day moving average at 158.05 | 158.1 at the time of writing, marginally above; whether it holds |
なお、この記事の数字はすべてCFTCの「レガシー建玉報告(先物のみ・非商業部門)」から測っています。報道でよく引用される「レバレッジドファンド」系列は先物とオプションを合算した別の統計で、同じ週でも数字が異なります(8月4日時点で6.36万枚)。どちらが正しいという話ではなく、別のものさしです。比べるときは同じ系列同士で比べる必要があります。
Note that every figure in this article is measured from the CFTC legacy Commitments of Traders report, futures only, non-commercial. The leveraged funds series often quoted in the press is a different statistic combining futures and options, and gives different numbers for the same week (63,600 contracts as of August 4). Neither is more correct; they are different yardsticks. Comparisons must be made within the same series.
そして、こういう相場の話が一番おもしろくなるのは、モニターの前ではなく、人と話しているときです。介入があった週の飲み会では、誰かが必ず「あれ、効いたの?」と聞きます。今回であれば、答えは「効いた。しかも売り手を減らしただけじゃなく、買い手を作ってしまった」です。データの裏付けまで話せると、その場の空気が少し変わります。
And market talk like this is at its most enjoyable not in front of a monitor but in conversation. At a drinks gathering in the week of an intervention, someone always asks whether it worked. This time the answer is that it worked, and that it did more than reduce sellers, it created buyers. Being able to back that up with data changes the mood of the table a little.
そういう夜のために、店を探して予約する手間まで背負う必要はありません。人数と日時と、だいたいの雰囲気を伝えるだけで、条件に合う店を探して押さえるところまで。店探しと予約は、Omochiにお任せください。
For evenings like that, you do not need to shoulder the work of finding a restaurant and booking it. Just tell us the headcount, the date and time, and roughly the atmosphere you want, and we will find somewhere that fits and secure the table. Leave the search and the reservation to Omochi.