9月利上げは消えたのか。2週間のデータと、動かなかった2年債
Did the September Hike Disappear? Two Weeks of Data and a 2-Year Yield That Never Moved
2026年8月12日、米労働統計局が7月の消費者物価指数を発表しました。前月比プラス0.1%、前年比3.4%。コアは前月比プラス0.2%、前年比2.5%。事前予想は4項目すべて同じ数字でした。
On August 12, 2026, the US Bureau of Labor Statistics released the July consumer price index. Up 0.1% month-over-month, 3.4% year-over-year. Core was up 0.2% and 2.5%. All four figures matched consensus exactly.
完全な予想通り。つまり、ニュースとしては何も起きていない統計です。
Entirely as expected. As news, nothing happened.
その4時間半後、米財務省が420億ドルの10年国債入札を実施しました。最高落札利回りは4.683%。10年債の入札としては2007年8月以来、およそ19年ぶりの高さです。
Four and a half hours later, the Treasury auctioned $42 billion of 10-year notes. The high yield was 4.683%, the highest at a 10-year auction since August 2007, roughly 19 years.
同じ日、同じ市場で、物価は落ち着いたという数字と、金利は19年ぶりの高さを要求するという数字が並びました。この記事は、その矛盾を解きます。
Same day, same market: one number saying inflation has calmed, another demanding the highest yield in 19 years. This article resolves that contradiction.
結論から言うと、矛盾していません。債券市場が変えたのは「答え」ではなく「日程」でした。
The short answer: there is no contradiction. What the bond market changed was not its answer, but its schedule.
「予想通り」の中に、5年ぶりの数字が入っていた
Inside the "as expected" print was a five-year low
まず、発表された統計そのものを測り直します。
Let us start by re-measuring the release itself.
私たちはFRED経由でBLSの指数原数値を取得し、独自に計算しました。2026年7月の指数は333.918、2025年7月は323.048。前年比は3.365%で、BLS公表の3.4%と一致します。ここまでは報道の通りです。
We pulled the raw BLS index levels via FRED and computed the figures ourselves. The July 2026 index is 333.918 against 323.048 in July 2025, a year-over-year rate of 3.365%, which matches the published 3.4%. So far, so consistent with the reporting.
興味深いのはコアのほうです。
The interesting part is core.
コアCPIの前年比は2.47%。これは2021年3月以来、5年4ヶ月ぶりの低さです。24ヶ月・36ヶ月・48ヶ月・60ヶ月、どの窓で見ても最低値でした。
Core CPI is up 2.47% year-over-year. That is the lowest since March 2021, five years and four months ago. It is the minimum across every window we tested: 24, 36, 48 and 60 months.
さらに、前年比よりも新しい情報を含む指標があります。直近3ヶ月を年率換算した数字です。
There is also a measure that carries fresher information than the year-over-year rate: the last three months, annualized.
コアCPIの3ヶ月年率は1.64%。FRBの目標である2%を下回っています。
Core CPI on a three-month annualized basis is running at 1.64%, below the Federal Reserve's 2% target.
2021年1月以降の67ヶ月で、この水準を下回ったのは8回だけです。
In the 67 months since January 2021, it has been this low only eight times.
※ 3ヶ月年率とは、直近3ヶ月の物価変化がそのまま1年続いた場合の上昇率を計算したものです。前年比は最大11ヶ月前の水準を基準に含むため、転換点は3ヶ月年率のほうに先に現れます。
※ The three-month annualized rate is what inflation would be if the past three months' pace continued for a full year. Because the year-over-year rate still carries a base from up to 11 months ago, turning points show up in the three-month figure first.
なぜこの差が生まれるのか。前年比は「1年前と比べていくら上がったか」であり、1年前に何が起きたかに強く影響されます。今の物価の勢いを知りたいなら、直近の数ヶ月だけを見るほうが早い。そして直近3ヶ月の勢いは、すでに目標を割っています。
Why the gap? The year-over-year rate asks how much prices rose against a year ago, so it is heavily shaped by what happened back then. If you want to know the current momentum of prices, the recent months tell you sooner. And that recent momentum is already below target.
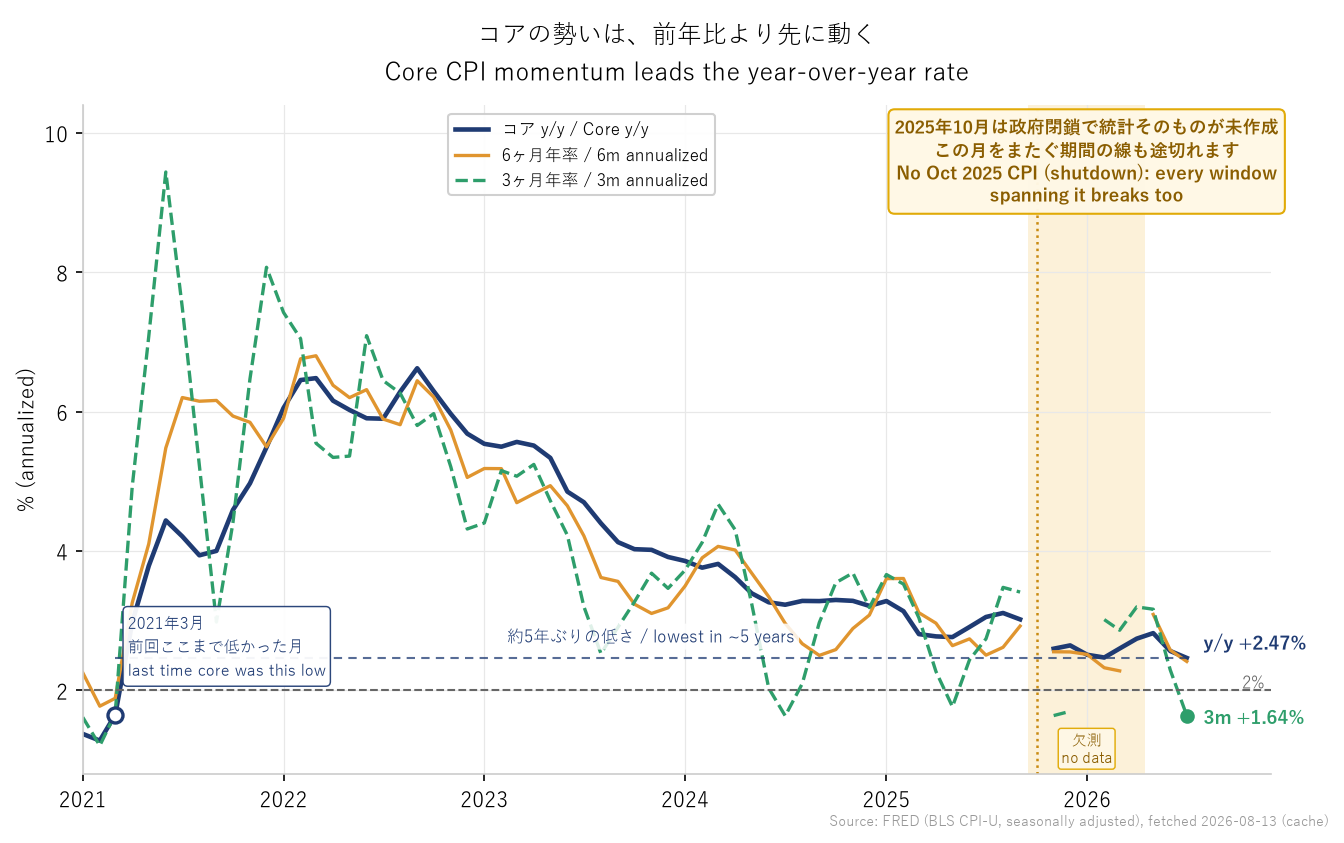
グラフの2025年後半に線の途切れがありますが、これは作図の不具合ではありません。2025年10月のCPIは、政府閉鎖で調査そのものが行われず、存在しません。 米労働統計局は遡って収集することはできないとして、この月の数字を公表しないと明言しています。月次系列としては1921年1月以来はじめての断絶です。
The break in the lines in late 2025 is not a plotting error. There is no October 2025 CPI: the government shutdown suspended collection entirely. The Bureau of Labor Statistics stated it cannot retroactively collect the data and will not publish a figure for that month, the first break in the monthly series since January 1921.
私たちはこの空白を推計で埋めていません。埋めれば、存在しない公式統計を作り出すことになるからです。なお1ヶ月の欠測は1ヶ月分の穴では済まず、その月をまたぐ3ヶ月年率・6ヶ月年率の線も、それぞれ数ヶ月後に途切れます。 グラフではその影響範囲をまとめて色付けしています。
We have not filled that gap with an estimate, because doing so would manufacture an official statistic that does not exist. Note also that a single missing month does not leave a single hole: the three- and six-month annualized lines break again, months later, when their windows reach back across it. The charts shade the whole affected span for that reason.
では、なぜヘッドラインは3.4%なのか
So why does the headline still say 3.4%?
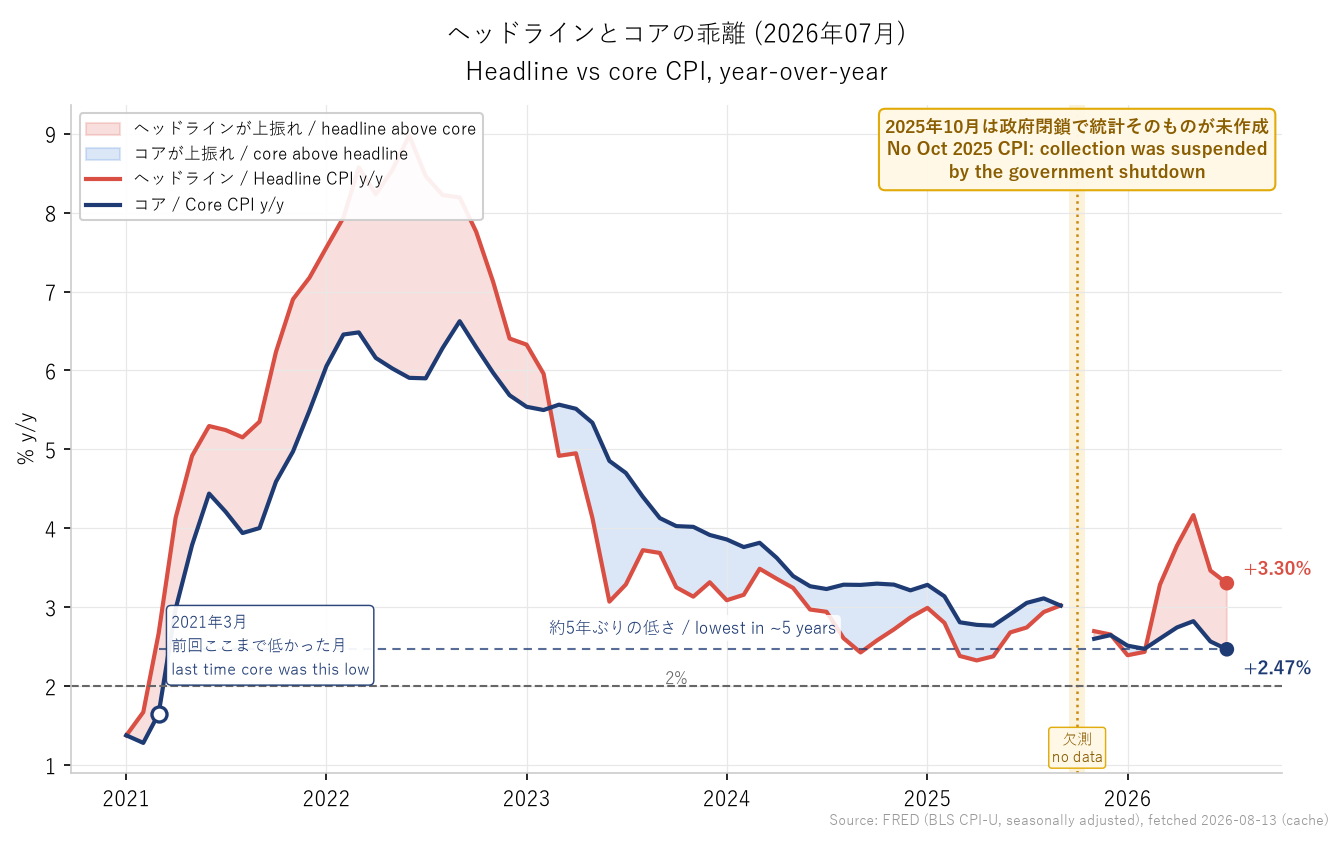
コアが2.47%で、全体が3.30%。この0.84ポイントの差は、歴史的に見て83パーセンタイルの大きさです。つまり過去の同じ指標を全部並べたとき、今回より差が小さかった月が83%あった、ということです。
Core is at 2.47% while the all-items rate is 3.30%. That 0.84-point gap sits at the 83rd percentile historically, meaning that in 83% of past months the gap was smaller than it is now.
※ パーセンタイルとは、過去のデータを小さい順に並べたとき、その値が下から何%の位置にあるかを示す数字です。50パーセンタイルなら「ちょうど真ん中=ごく平均的」、96パーセンタイルなら「過去の96%より高く、極めて珍しい水準」を意味します。「高い・低い」という印象ではなく、歴史の中での位置を客観的に示すために使います。
※ A percentile tells you where a value sits when all past observations are lined up from smallest to largest. The 50th percentile is dead average; the 96th means the value is higher than 96% of history, an unusual level. It replaces an impression of "high" or "low" with an objective position in the historical record.
差の正体は、ほぼ全部エネルギーでした。
The gap is almost entirely energy.
エネルギーCPIの前年比は、2026年1月のマイナス0.30%から5月にはプラス22.97%まで跳ね上がりました。全体の前年比を2.4%から4.2%へ押し上げたのは、この動きです。
Energy CPI went from -0.30% year-over-year in January 2026 to +22.97% by May. That move is what pushed the all-items rate from 2.4% to 4.2%.
原因は中東でした。2026年2月28日、米国とイスラエルによるイラン攻撃が始まり、ホルムズ海峡が封鎖されます。ブレント原油の月次平均は2月の1バレル70.89ドルから4月には117.29ドルへ。4月30日には一時126ドルをつけました。
The cause was the Middle East. On February 28, 2026, US and Israeli strikes on Iran began and the Strait of Hormuz was closed. Brent crude's monthly average went from $70.89 a barrel in February to $117.29 in April, touching $126 intraday on April 30.
ここに、記事として面白い時間差があります。原油は4月にピークをつけたのに、CPIのエネルギー指数は5月にピークをつけました。
Here is a lag worth noticing. Crude peaked in April, but the CPI energy index peaked in May.
理由は小売への価格転嫁のラグです。EIAの週次データでは、小売ガソリン価格のピークは5月11日の1ガロン4.500ドル。私たちが測定したCPIガソリン指数のピークも5月です。原油価格とCPIという独立した2つのデータセットが、同じラグを示しました。
The reason is the lag in pass-through to retail. In the EIA's weekly data, retail gasoline peaked at $4.500 a gallon on May 11. The CPI gasoline index we measured also peaks in May. Two independent datasets, crude prices and consumer prices, show the same lag.
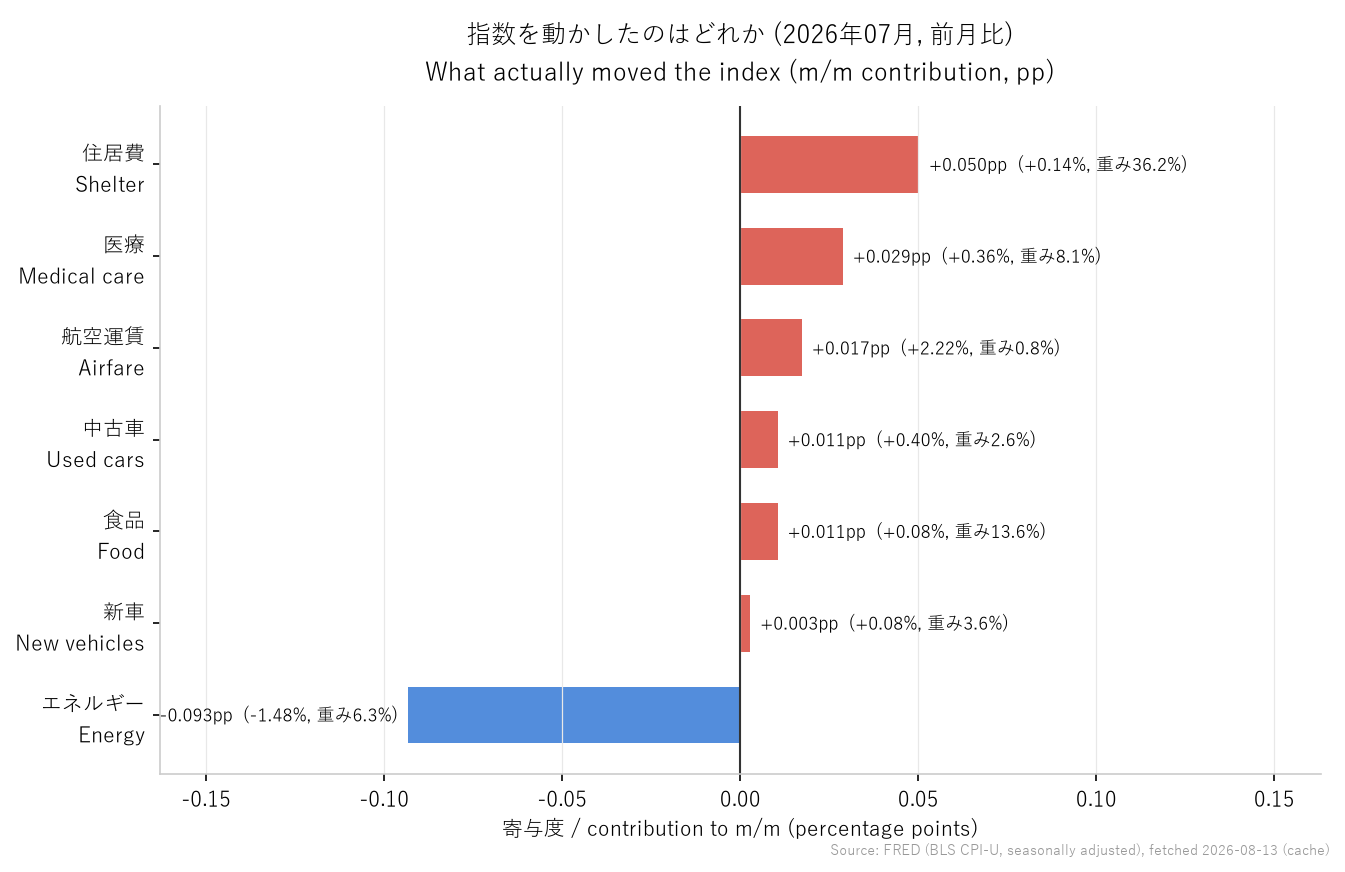
そして今、その剥落が始まっています。エネルギーの前年比はまだプラス14.45%と高いのですが、前月比はマイナス1.48%、3ヶ月年率にいたってはマイナス13.30%です。
That effect is now unwinding. Energy is still up 14.45% year-over-year, but it fell 1.48% on the month, and on a three-month annualized basis it is running at -13.30%.
前年比が高いのは、1年前が安かったからにすぎません。 基準となる去年の月が高い水準に入れ替わっていくため、この数字は機械的に下がっていきます。
The year-over-year rate is high only because a year ago was cheap. As the base months roll forward into the elevated period, that figure falls mechanically.
今月、指数を実際に動かしたのが何かを寄与度で見ると、もっとはっきりします。
Looking at what actually moved the index this month, in contribution terms, makes it clearer still.
ただし、この剥落は確定ではありません。ホルムズ海峡は8月10日時点でも実質的に封鎖されたままです。7月8日に停戦が崩れたとき、小売ガソリンは3.777ドルから4.096ドルへ再上昇しました。再燃すれば前提ごと崩れる、という留保は必要です。
That unwinding is not secure, however. As of August 10 the Strait of Hormuz remained effectively closed. When the ceasefire collapsed on July 8, retail gasoline climbed back from $3.777 to $4.096. If the shock re-fires, the whole premise goes with it.
2週間のデータは「弱かった」のか
Was the past two weeks of data actually "soft"?
9月FOMCまでの議論を追うには、CPIだけでは足りません。この2週間に何が出たのかを並べます。
To follow the debate into the September FOMC, CPI alone is not enough. Here is what else landed in the past two weeks.
「弱い」と要約されがちですが、実際には労働と生産できれいに分かれていました。
It gets summarized as "soft," but it actually splits cleanly between labor and output.
| 弱かったもの | 強かったもの |
|---|---|
| 雇用者数 -2.3万人(予想+8.3万人) | ISM製造業 55.6(4年ぶり高水準) |
| 5月分が6.6万人下方修正 | 新規失業保険申請 20万件割れ(1969年以来最長の連続) |
| ADP +4.4万人(予想+7.0万人) | 失業率は4.2%→4.1%に低下 |
| 4-6月期GDP 1.5%(予想2.0%) | ISMサービス業の価格指数 70.3(予想65.0) |
| ISMサービス業の雇用 47.4 | 生産者物価 前年比+5.5% |
| Soft | Strong |
|---|---|
| Payrolls -23k (vs +83k expected) | ISM manufacturing 55.6, a 4-year high |
| May revised down 66k | Jobless claims below 200k, longest streak since 1969 |
| ADP +44k (vs +70k) | Unemployment fell to 4.1% |
| Q2 GDP 1.5% (vs 2.0%) | ISM services prices 70.3 (vs 65.0) |
| ISM services employment 47.4 | Producer prices +5.5% y/y |
一見矛盾していますが、機序を考えると整合します。新規失業保険申請は「解雇」を測り、雇用者数は「採用」を測ります。 企業は解雇していない。ただ、採用を止めた。景気後退ではなく、低回転の凍結です。
It looks contradictory until you consider the mechanism. Jobless claims measure firing; payrolls measure hiring. Firms are not letting people go. They have simply stopped hiring. This is not a downturn but a low-churn freeze.
だから両陣営とも「労働市場を見ろ」と言いながら、正反対の結論に到達できます。
Which is how both camps can say "look at the labor market" and arrive at opposite conclusions.
市場は2週間で利上げ観測を落とした
The market priced out the hike in two weeks
この2週間、9月利上げの織り込みは劇的に動きました。
Over these two weeks, the odds of a September hike moved dramatically.
| 日付 | 利上げ確率 | きっかけ |
|---|---|---|
| 7月31日 | 67% | FOMC後のタカ派的な受け止め |
| 8月4日 | 61.9% | |
| 8月5-6日 | 56.7% | ウォーシュ議長の利上げ用意が報道される |
| 8月7日 | 44% | 雇用統計 -2.3万人 |
| 8月11日 | 約48% | |
| 8月12日 | 38% | CPIが予想通り |
| Date | Sept hike odds | Trigger |
|---|---|---|
| Jul 31 | 67% | Hawkish read of the FOMC |
| Aug 4 | 61.9% | |
| Aug 5-6 | 56.7% | Reports that Warsh is prepared to hike |
| Aug 7 | 44% | Payrolls -23k |
| Aug 11 | ~48% | |
| Aug 12 | 38% | CPI in line |
2週間前、市場は利上げをメインシナリオとして織り込んでいました。今は違います。
Two weeks ago the market had a hike as its base case. It no longer does.
ここで因果を正確にしておきます。この織り込みを崩したのは雇用統計であって、CPIではありません。 雇用統計で10.7ポイント、CPIで10ポイント動いていますが、方向を決めたのは前者でした。モルガン・スタンレーのエレン・ゼントナー氏の表現が正確です。予想通りのインフレは「先週の雇用統計後に定着した『利上げ不要』論を維持させる」。
The causation matters here. What broke the pricing was the jobs report, not the CPI. The employment print moved it 10.7 points and the CPI 10 points, but the former set the direction. Morgan Stanley's Ellen Zentner put it precisely: in-line inflation "will keep the 'no need to hike rates' narrative that took hold after last week's jobs report intact."
CPIをきっかけに利上げ予想を撤回したエコノミストは、確認した範囲で一人もいませんでした。
As far as we could verify, not a single economist withdrew a hike call because of the CPI.
それでも、2年債は動かなかった
And yet the 2-year never moved
ここからが本題です。
This is the heart of it.
短期金利の予想を最も素直に反映するのは2年債です。そして2年債は、この2週間、ほとんど動きませんでした。
The instrument that most directly reflects expectations for short-term rates is the 2-year Treasury. And over these two weeks, it barely moved.
- 7月31日:4.28%
- 8月11日:4.22%
- 2週間の正味:わずか-6bp
- 3週間のレンジ:4.18%〜4.37%
- July 31: 4.28%
- August 11: 4.22%
- Net over two weeks: just -6bp
- Three-week range: 4.18% to 4.37%
雇用者数がマイナスに沈み、CPIが目標に近づいた2週間で、2年債利回りは6bpしか下がっていません。0.06%です。
Across two weeks in which payrolls went negative and CPI moved closer to target, the 2-year yield fell all of 6bp. That is 0.06%.
※ bpとはベーシスポイントの略で、0.01%を1bpと数えます。金利の世界では0.01%の差が大きな意味を持つため、「0.06%下がった」と言うより「6bp下がった」と表現するのが慣例です。100bpで1%になります。
※ A basis point (bp) is 0.01%. In rates markets a hundredth of a percent carries real meaning, so the convention is to say "fell 6bp" rather than "fell 0.06%." One hundred basis points equals 1%.
しかも、水準そのものが重要です。2年債4.22%に対し、実効フェデラルファンド金利は3.63%。差は+59bpです。
The level itself matters too. Against a 2-year at 4.22%, the effective federal funds rate is 3.63%. The gap is +59bp.
2年債が政策金利より高いということは、市場が「今後2年間の平均政策金利は今より高い」と見ているということです。つまり、引き締め方向のバイアスは残っています。
A 2-year yield above the policy rate means the market expects the average policy rate over the next two years to be higher than it is today. The tightening bias is still there.
※ 実効フェデラルファンド金利とは、FRBが誘導目標として定める幅(現在3.50-3.75%)の中で、実際に銀行間で取引された金利の加重平均です。
※ The effective federal funds rate is the weighted average of rates actually transacted between banks, within the target range the Fed sets (currently 3.50-3.75%).
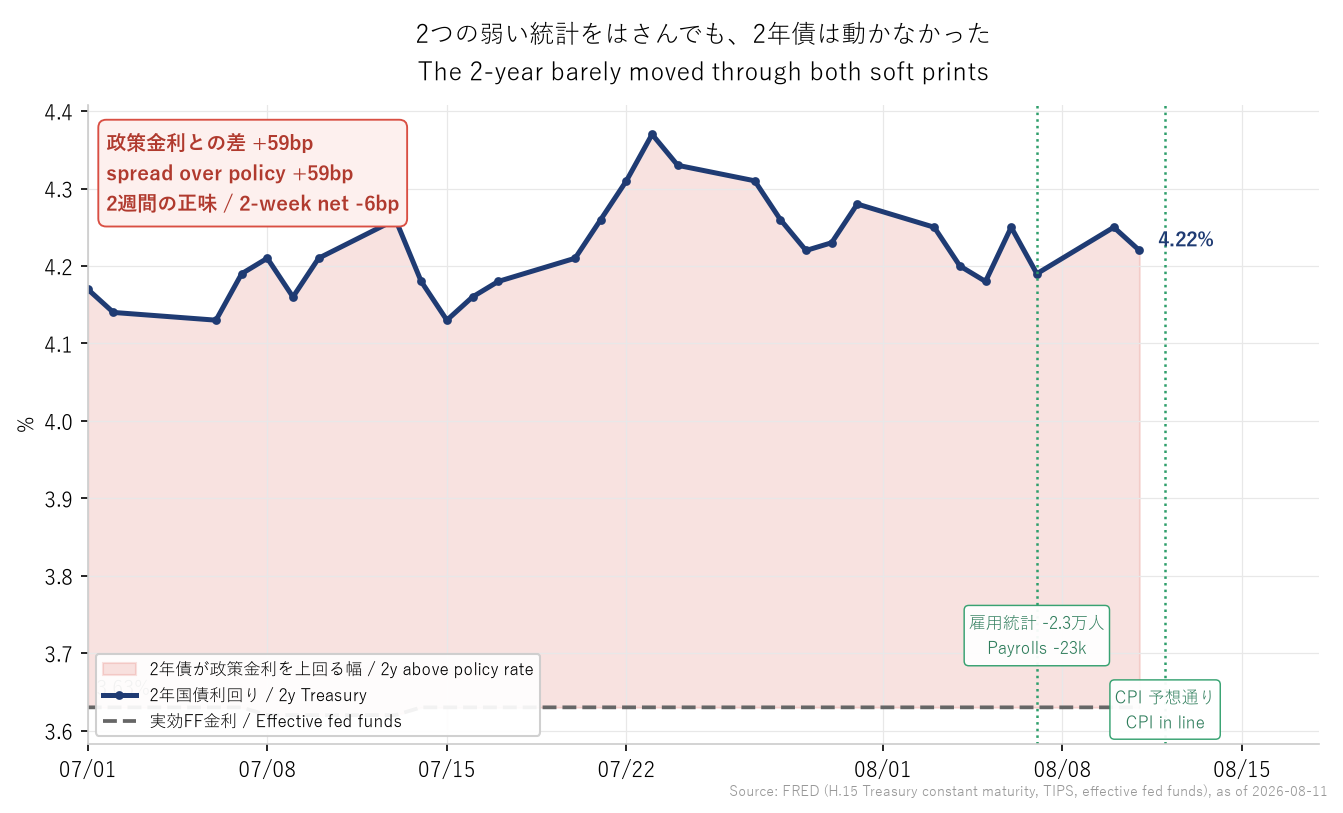
ただし、ここは正直に書きます。この+59bpという差は2000年以降の73パーセンタイル、つまり過去の4分の3ほどの局面より引き締め寄りではあります。しかし過去の利上げ局面の入り口と比べると弱いのです。2015年12月の利上げ開始時は+87bp、2022年3月は+187bpありました。傾いてはいるが、確信はしていない。それが2年債の状態です。
One honest caveat. That +59bp sits at the 73rd percentile since 2000, so it is tighter than roughly three quarters of history. But it is weaker than at the start of past hiking cycles: +87bp in December 2015, +187bp in March 2022. Leaning, but not convinced. That is where the 2-year stands.
19年ぶりの高値をつけた入札の中身
Inside the auction that cleared at a 19-year high
冒頭の入札に戻ります。
Back to the auction we opened with.
まず数字を確認しておくと、4.683%という利回りは正しく、財務省の公式データで確認できます(8月12日、420億ドル)。
The 4.683% figure is correct and verifiable in the Treasury's official data (August 12, $42 billion).
ただし、この数字につけられた「金融危機以来の高さ」という説明は誤りです。しかも逆向きに誤っています。金融危機のさなかの10年債入札は、4.225%、4.075%、3.990%。危機のときは安全資産に資金が逃げ込むため、利回りはむしろ急落しました。
But the label attached to it, "the highest since the financial crisis," is wrong, and wrong in the opposite direction. Auctions during the crisis itself cleared at 4.225%, 4.075% and 3.990%. In a crisis, money floods into safe assets, so yields collapsed rather than rose.
4.683%を上回る入札が最後にあったのは2007年8月8日(4.855%)、つまり危機の前です。正しくは「2007年8月以来、約19年ぶり」。なお2番目に高いのは2025年1月7日の4.680%で、わずか0.3bp下です。19年ぶりの高さではあるものの、直近からの劇的な断絶ではありません。
The last auction above 4.683% was on August 8, 2007, at 4.855%, which is before the crisis. The accurate phrasing is "the highest since August 2007, roughly 19 years." Worth noting: the runner-up is January 7, 2025 at 4.680%, only 0.3bp lower. A genuine 19-year high, but not a dramatic break from the recent past.
そしてもう一つ重要なのは、この入札は弱くなかったということです。
The other important point is that this was not a weak auction.
- テールは0.1bp(ほぼ想定通りの利回りで消化された)
- 間接入札者76.7%、平均の71.3%を上回る
- プライマリーディーラーの引き取りは8.6%と低い
- A 0.1bp tail (it cleared almost exactly at the expected yield)
- Indirect bidders at 76.7%, above the 71.3% average
- Primary dealer takedown at just 8.6%
※ 間接入札者とは、ニューヨーク連銀を経由して入札に参加する投資家で、その多くは海外の中央銀行や政府系ファンドです。この比率は海外勢の米国債需要を測る代表的な目安として使われます。
※ Indirect bidders are investors who bid through the New York Fed, many of them foreign central banks and sovereign funds. The share is a standard proxy for overseas demand for Treasuries.
※ テールとは、国債入札で実際に決まった利回りが、入札直前に市場で取引されていた利回りをどれだけ上回ったかを示す差です。買い手が集まらないと、財務省は予定量を売り切るために利回りを上乗せする必要があり、この差が広がります。逆に差がほぼゼロなら、想定通りの条件で無理なく消化できたことを意味します。今回は0.1bp、事実上ゼロでした。
※ The tail is the gap between the yield an auction actually clears at and the yield trading in the market just beforehand. If buyers are scarce, the Treasury has to add yield to sell the full amount, and the gap widens. A gap near zero means the issue was absorbed comfortably on expected terms. This time it was 0.1bp, effectively zero.
3つとも同じ方向を指しています。順に見ていきます。
All three point the same way. Taking them in turn.
テールがほぼゼロということは、高い利回りを提示しないと売れなかったわけではない、ということです。
A near-zero tail means the issue did not require an extra yield concession to sell.
間接入札者の比率が平均を上回ったのは、海外中銀を含む実需の買い手が積極的だったということです。
Indirect bidders above average means real-money buyers, including foreign central banks, showed up in force.
そして3つ目が、実は入札の評価でいちばん使われる指標です。プライマリーディーラーの引き取りが8.6%と低い。
And the third is the metric most used to grade an auction. Primary dealer takedown was low, at 8.6%.
※ プライマリーディーラーとは、米国債の入札に必ず参加する義務を負う、財務省が指定した金融機関です。2026年時点で24社あり、大手投資銀行や証券会社が名を連ねています。彼らは「最後の買い手」として、投資家の需要で埋まらなかった分を引き受ける役割を担っています。
※ Primary dealers are financial institutions designated by the Treasury that are obliged to participate in every auction. As of 2026 there are 24 of them, mostly major investment banks and securities firms. They act as the buyer of last resort, absorbing whatever investor demand does not cover.
この役割を知ると、比率の読み方が反転します。プライマリーディーラーの引き取り比率が高い入札は、良い入札ではありません。
Once you know that role, the ratio reads backwards from intuition. An auction with a high dealer takedown is not a good auction.
投資家の需要が旺盛なら、国債はその場で買い手に渡ります。ディーラーが引き受ける分は少なくて済む。逆に需要が細ければ、義務を負っている彼らが売れ残りを在庫として抱え込むことになります。抱えた在庫はいずれ市場で売らなければならず、それが将来の値下がり圧力にもなります。
When investor demand is strong, the bonds go straight to buyers and dealers need to take very little. When demand is thin, the dealers, being obliged to bid, end up holding the leftovers as inventory. That inventory has to be sold into the market eventually, which becomes future downward pressure on prices.
今回の8.6%は低い水準でした。つまり義務で引き取らされた業者がほとんどいなかった、投資家が自発的に買っていった入札だった、ということです。
At 8.6%, this was low. Almost no dealer was forced to absorb anything. Investors bought it voluntarily.
言い換えれば、この3つの指標は「高い利回りだったが、それは買い手がいなかったからではない」という同じ結論を、別々の角度から示しています。
Put differently, all three metrics deliver the same conclusion from different angles: the yield was high, but not because buyers were absent.
高い利回りの正体は、物価予想ではない
What the high yield is actually made of, and it is not inflation
なぜ高い利回りを要求するのか。ここで分解すると答えが出ます。
So why demand a high yield? Decomposing it gives the answer.
10年債利回りは、大きく「実質金利」と「期待インフレ率」に分けられます。そして便利なことに、この2つは市場価格から直接読み取れます。
The 10-year yield breaks broadly into a real yield and expected inflation. Conveniently, both can be read directly off market prices.
※ TIPSとは、物価連動国債(Treasury Inflation-Protected Securities)の略で、元本が消費者物価指数に連動して増減する米国債です。物価が上がれば元本も増えるため、投資家は物価上昇分を差し引いた「実質」の利回りだけを受け取ります。つまりTIPSの利回りは、そのまま市場が織り込む実質金利になります。
※ TIPS stands for Treasury Inflation-Protected Securities, US government bonds whose principal rises and falls with the consumer price index. Because the principal grows with inflation, the investor receives only the "real" return net of it. That makes the TIPS yield the market's real interest rate directly.
やり方はこうです。まずTIPSの利回りを見れば、実質金利がわかります。次に、同じ満期の通常の国債の利回りからTIPSの利回りを引きます。通常の国債は物価上昇のリスクを投資家が負うため、その差額が「市場が織り込んでいる将来の物価上昇率」になります。 これをブレークイーブン・インフレ率(BEI)と呼びます。
The method runs like this. The TIPS yield gives you the real rate. Then subtract that TIPS yield from an ordinary Treasury of the same maturity. Since holders of ordinary Treasuries bear the inflation risk themselves, the difference is the rate of future inflation the market is pricing in. This is the breakeven inflation rate.
※ ブレークイーブン・インフレ率とは、通常の国債の利回りから物価連動国債(TIPS)の利回りを差し引いた値です。この率を境に、どちらの国債を買っても損得が等しくなることから「ブレークイーブン(損益分岐)」と呼ばれます。市場参加者の物価見通しを表す代表的な指標です。
※ The breakeven inflation rate is an ordinary Treasury yield minus the yield on an inflation-protected bond of the same maturity. At exactly that rate of inflation, an investor would do equally well holding either bond, hence "breakeven." It is the standard market-based gauge of inflation expectations.
重要なのは、どちらもエコノミストの予想ではなく、実際にお金を出している投資家が形成した価格から出てくる数字だということです。
What matters is that neither number is an economist's forecast. Both come out of prices set by investors putting real money down.
| 指標 | 水準 | 過去との比較 |
|---|---|---|
| 10年債(名目) | 4.70% | |
| 10年実質金利(TIPS) | 2.43% | 2003年以降の96パーセンタイル |
| 10年期待インフレ率(BEI) | 2.26% | 54パーセンタイル |
| Metric | Level | Historical context |
|---|---|---|
| 10y nominal | 4.70% | |
| 10y real yield (TIPS) | 2.43% | 96th percentile since 2003 |
| 10y breakeven inflation | 2.26% | 54th percentile |
この2つのパーセンタイルの対比が、この記事でいちばん重要な数字です。実質金利は2003年以降で96%の期間より高い、つまりほぼ最高水準。一方の期待インフレ率は54%、ほぼ真ん中で、まったく珍しくありません。片方だけが極端なのです。
The contrast between those two percentiles is the single most important pair of numbers in this article. The real yield is higher than in 96% of the period since 2003, near its maximum. Expected inflation sits at 54%, essentially the middle, entirely unremarkable. Only one of the two is extreme.
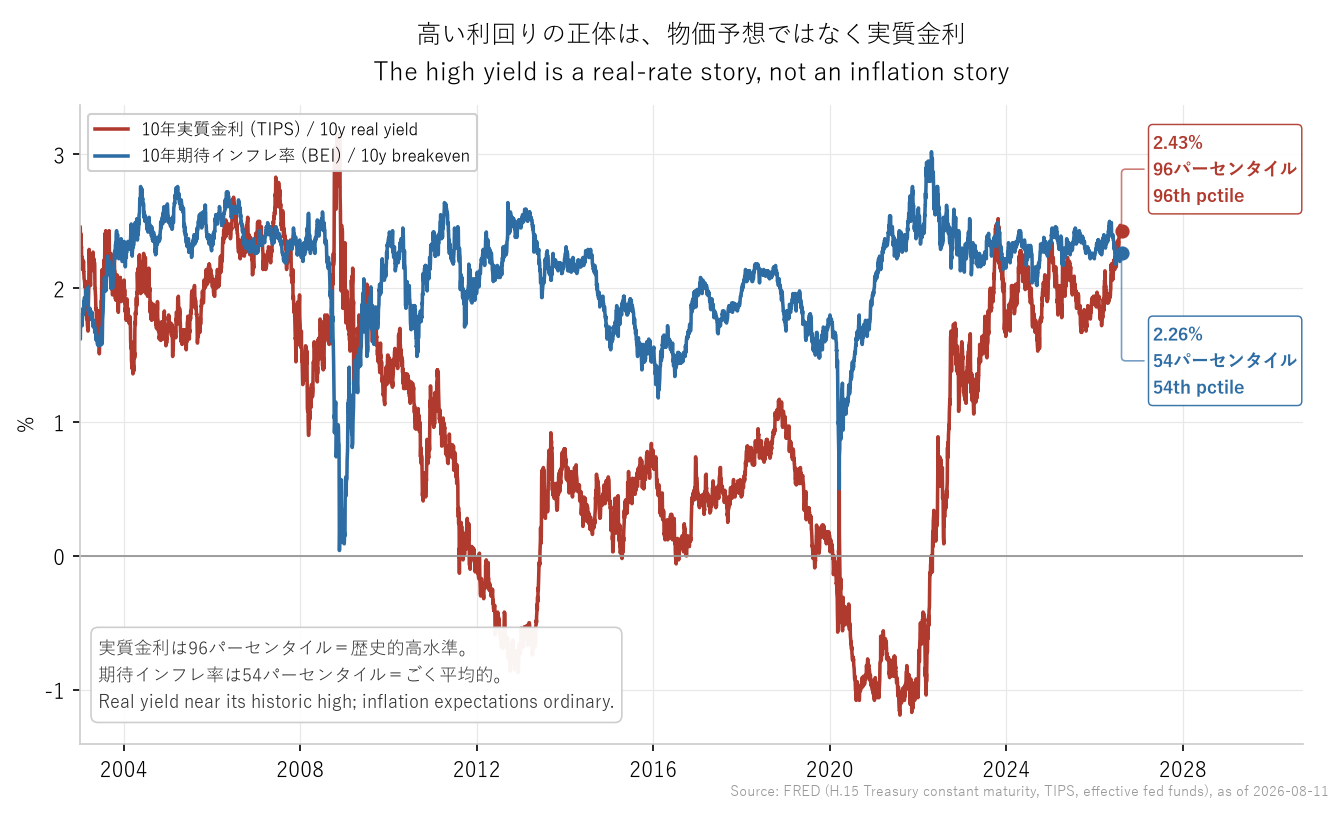
年初来で見ると、10年債は+51bp上昇しましたが、その内訳は実質金利+49bp、期待インフレ率+1bpです。
Year to date, the 10-year is up 51bp. The split is +49bp from the real yield and just +1bp from expected inflation.
債券市場は、インフレを恐れて金利を要求しているのではありません。 期待インフレ率は2.26%、ごく平凡な水準です。2022年のピークは3.02%でしたから、そこからは大きく落ち着いています。
The bond market is not demanding yield out of fear of inflation. Expected inflation is 2.26%, a thoroughly ordinary level, well down from the 3.02% peak in 2022.
上がっているのは実質金利のほうです。ゼロ金利時代(2010-2021年)の実質金利の平均は0.22%、金融危機前(2003-2007年)でも2.06%でした。今の2.43%は、危機前の水準すら上回っています。
What has risen is the real yield. It averaged 0.22% through the zero-rate era of 2010 to 2021, and 2.06% even before the financial crisis in 2003 to 2007. Today's 2.43% is above even that pre-crisis norm.
※ 実質金利とは、名目金利から期待インフレ率を差し引いた金利です。物価上昇分を除いた「本当の資金コスト」を示します。
※ The real interest rate is the nominal rate minus expected inflation. It represents the true cost of money once price increases are stripped out.
名目金利をもう一段分解すると、期間プレミアム+24bp、金利予想+22bpと、おおむね半々でした。つまり財政・需給要因だけでもなく、利上げリスクも実際に含まれています。
Breaking the nominal yield down one level further gives roughly an even split: +24bp of term premium and +22bp of rate expectations. So this is not purely a fiscal and supply story. Genuine hike risk is in there too.
※ 期間プレミアムとは、長期の国債を持つ投資家が、長く保有することのリスク(財政悪化や金利変動など)の対価として上乗せを求める金利部分です。政策金利の予想とは別物で、国債の発行量が増えるときなどに拡大します。
※ The term premium is the extra yield investors demand as compensation for the risks of holding a bond for a long time, such as fiscal deterioration or rate volatility. It is distinct from expectations for the policy rate, and it widens when issuance grows.
動いたのは日程であって、方向ではない
What moved was the schedule, not the direction
ここまでの材料が一つの絵になります。
All of this resolves into a single picture.
9月の利上げ確率は38-42%まで落ちました。しかし12月は73-74%です。
The odds of a September hike fell to 38-42%. But December sits at 73-74%.
市場は利上げを取り下げたのではありません。日付を動かしただけです。
The market did not withdraw the hike. It moved the date.
セージ・アドバイザリーのロブ・ウィリアムズ氏の説明が、この日の市場を最もよく表しています。
Rob Williams of Sage Advisory captured the day best.
> 「CPIと雇用統計の組み合わせが、9月を選択肢から外した」
> 「市場は12月に集まりつつある。もう少し時間が必要で、雇用と物価の統計があと数回分ほしいからだ」
> "The combination of CPI and payroll takes September off the table."
> "The markets are gravitating towards December because you need a little space and have a couple more prints of both employment and CPI."
先物は「いつ」を織り込みます。2年債は「どこへ」を織り込みます。先物が9月を外した一方で、2年債が動かなかったのは、この2つが別の問いに答えているからです。
Futures price the when. The 2-year prices the where to. Futures dropped September while the 2-year stayed put because the two are answering different questions.
だから冒頭の矛盾は、矛盾ではありませんでした。物価は落ち着いている。だが、到達点についての見方は変わっていない。変わったのは道順だけです。
So the contradiction we opened with was never a contradiction. Inflation has calmed. The view on the destination has not changed. Only the route did.
なぜ利上げ観測が生き残るのか
Why the hike case survives sub-target core inflation
コアの3ヶ月年率が目標を割っているのに、なぜ利上げの話が消えないのか。
If core inflation on a three-month basis is already below target, why has the hike discussion not gone away?
理由は、利上げを主張する側がインフレ予想の話をしていないからです。彼らの主張は「そもそも今の金利は引き締め的ではない」というものです。
Because the people arguing for a hike are not making an inflation forecast. Their claim is that current rates are not restrictive in the first place.
ミネアポリス連銀のカシュカリ総裁は8月5日にこう言っています。
Neel Kashkari of the Minneapolis Fed, on August 5:
> 「今の金融政策が特に引き締め的だという証拠が、どこにあるのか」
> "What evidence do I have that monetary policy is particularly restrictive right now?"
クリーブランド連銀のハマック総裁は、雇用統計が出た後の8月10日にこう述べました。
Beth Hammack of the Cleveland Fed, speaking on August 10, after the jobs report:
> 「25bpの利上げ1回では、経済に対してたいした効果はないだろう」
> "One 25 basis point move probably doesn't do a whole lot for the economy."
これは1回の利上げではなく、利上げ「局面」を主張しているということです。彼女は弱い雇用統計についても、12ヶ月平均が2〜2.5万人であることと失業率4.1%を挙げて、明確に取り合いませんでした。
That is an argument for a hiking cycle, not a single move. She also dismissed the weak jobs report outright, citing the 20,000 to 25,000 twelve-month average and 4.1% unemployment.
7月29日のFOMCは9対3の据え置きでしたが、反対票を投じなかったセントルイス連銀のムサレム総裁も「会合で25bpの利上げを選好すると表明した」と後に述べています。据え置きに投票したクック理事も「必要なら利上げによって行動する用意がある」と発言しました。タカ派は票数より多いのです。
The July 29 FOMC held rates 9-3, but Alberto Musalem of the St. Louis Fed, who did not dissent, later said he "expressed a preference at the meeting to raise the federal funds rate by 25 basis points." Governor Lisa Cook, who voted to hold, said she is "prepared to act by raising rates, if necessary." The hawkish bloc is larger than the vote count suggests.
この立場は、物価統計が落ち着いても揺らぎません。 だからCPIでは崩れず、雇用統計では崩れた。理屈が通っています。
That position does not weaken when inflation data cools. Which is exactly why the CPI did not dent it while the jobs report did. The logic is consistent.
そして彼らの主張は検証可能です。ハマック総裁は「企業は価格圧力が沈静化ではなく広がっていると述べている」と言いました。広がりの話であれば、測れます。
And their claim is testable. Hammack said businesses describe pricing pressures as broadening rather than fading. Breadth is something we can measure.
私たちが14系列について3ヶ月年率と前年比を比べたところ、加速していたのは4系列、減速は10系列でした。加速したのは中古車(+2.95ポイント)、医療(+0.47ポイント)、家賃(+0.25ポイント)、外食(+0.01ポイント)です。
Comparing three-month annualized rates against year-over-year rates across 14 series, we found four accelerating and ten decelerating. The four are used cars (+2.95 points), medical care (+0.47), primary rent (+0.25) and food away from home (+0.01).
中古車の反転は目を引きますが、全体として見れば、広がっているという主張を数字は支持していません。
The turn in used cars is striking. But taken as a whole, the numbers do not support the claim that pressure is broadening.
編集部の見立て
Our view
9月FOMCまでに、まだ材料が残っています。
There is still material to come before the September FOMC.
| 日付 | 予定 | なぜ重要か |
|---|---|---|
| 8月19日 | 7月FOMC議事要旨 | 反対票を投じなかった参加者のうち何人が利上げ寄りだったかが分かる |
| 8月27-29日 | ジャクソンホール | ウォーシュ議長にとって初。テーマは金融政策ではないが、フォワードガイダンス廃止後、唯一残った発信の場 |
| 8月末 | 7月PCE | FRBが実際に目標とする物価指標 |
| 9月上旬 | 8月雇用統計 | 前回、織り込みを崩した統計 |
| 9月10日頃 | 8月CPI | 会合前、最後の物価統計 |
| 9月15-16日 | FOMC(見通し公表あり) |
| Date | Event | Why it matters |
|---|---|---|
| Aug 19 | July FOMC minutes | Shows how many non-dissenters leaned hawkish |
| Aug 27-29 | Jackson Hole | Warsh's first as chair. Not a policy theme, but the only signalling channel left after forward guidance was abolished |
| End Aug | July PCE | The Fed's actual target measure |
| Early Sep | August jobs report | The release that broke the pricing last time |
| ~Sep 10 | August CPI | Last inflation print before the meeting |
| Sep 15-16 | FOMC (with projections) |
順番に一つ注意点があります。7月PCEはジャクソンホールの後に出ます。 つまりウォーシュ議長は、FRBが本来重視する物価指標が更新される前に話すことになります。
One wrinkle in the ordering. July PCE lands after Jackson Hole. Chair Warsh will therefore speak before the Fed's own preferred inflation gauge has been updated.
私たちの見立てはこうです。市場が9月を外したことは、利上げが終わったことを意味しません。2年債が政策金利より59bp高いまま動かず、12月が73-74%で織り込まれている以上、方向についての市場の答えは変わっていない。変わったのは日程だけです。
Our read is this. The market taking September off the table does not mean the hiking discussion is over. With the 2-year holding 59bp above the policy rate without budging, and December priced at 73-74%, the market's answer on direction has not changed. Only the schedule did.
そして興味深いのは、コアの3ヶ月年率がすでに1.64%と目標を割っているという事実が、この議論にほとんど登場していないことです。利上げを主張する側は「金利が引き締め的でない」と言い、慎重な側は「雇用が弱い」と言う。どちらも物価の最新の勢いの話をしていません。
What is striking is how little the fact that core is already running at 1.64% on a three-month basis, below target, features in the debate at all. The hawks argue rates are not restrictive; the cautious argue employment is weak. Neither side is discussing the most recent momentum in prices.
もし8月と9月のCPIでこの3ヶ月年率の低さが続けば、議論の前提そのものが変わる可能性があります。逆にホルムズ海峡が再燃すれば、ヘッドラインが再び跳ね、話は振り出しに戻ります。
If the August and September CPI prints keep that three-month rate this low, the premise of the whole debate could shift. If the Strait of Hormuz flares up again, the headline jumps and we are back at the start.
ところで、こういう「予想通りでした」で片づけられた統計の中身を掘り返して、実は5年ぶりの数字が入っていた、という話は、上司につれられていく飲みで一目置かれる話です。相手が金融の人でも、そうでなくても、「みんなが見ている数字と、実際に効いている数字は違う」という話はどこでも通じる。
Incidentally, digging into a release everyone wrote off as "in line" and finding a five-year low inside it is exactly the sort of thing that earns you a second look at a work dinner. Whether the person across the table is in finance or not, the idea that the number everyone watches and the number that actually matters are different lands anywhere.
ビジネス絡みの話がしたくなったとき、店を探すところで時間を使うのはもったいない。店探しと予約はOmochiにお任せください。
When that kind of conversation is on the agenda, spending your time hunting for a restaurant is a waste. Leave finding the place and booking it to Omochi.