世界中で金利が上がっているのに、株が崩れない理由。
Why Yields Are Rising Everywhere and Stocks Are Not Breaking
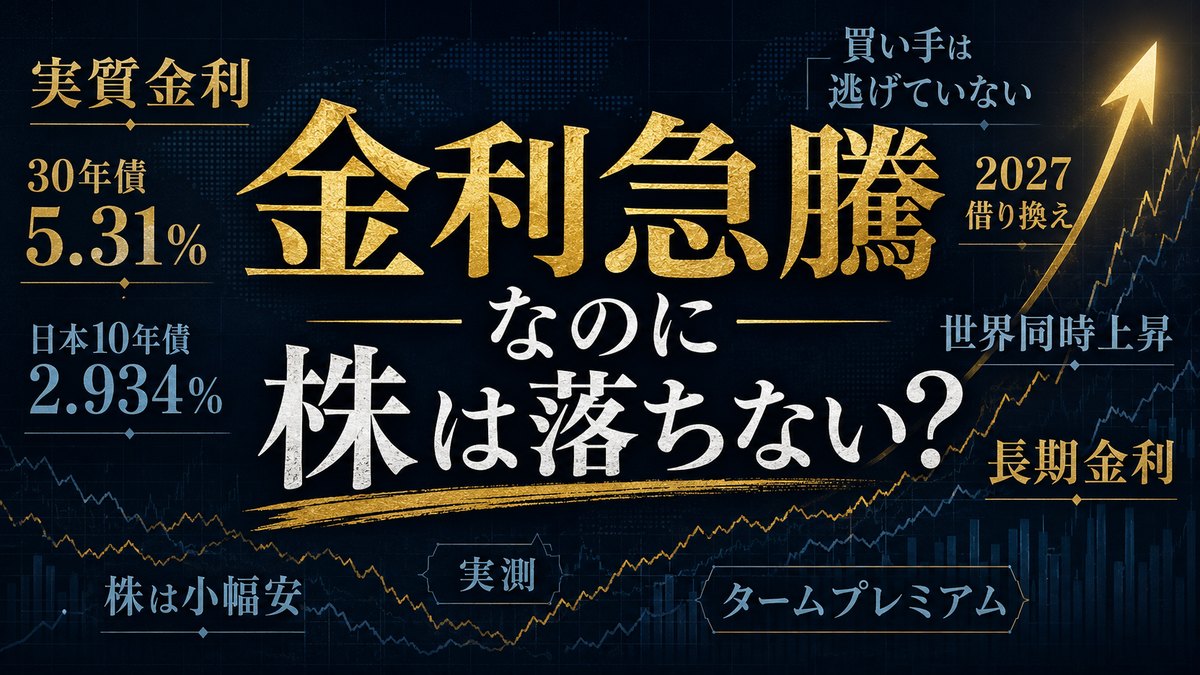
2026年8月17日から18日にかけて、三つの数字が並びました。日本の10年国債の利回りが2.934%。同じ水準を最後に見たのは1996年9月です。アメリカの30年国債は5.31%で、2007年以来の高さ。そして同じ日、S&P500の下げ幅は0.3%から0.5%でした。
Between 17 and 18 August 2026, three numbers lined up. Japan's 10-year government bond yielded 2.934%, a level last seen in September 1996. The US 30-year hit 5.31%, its highest since 2007. And on the same day, the S&P 500 fell only 0.3% to 0.5%.
国債の利回りが数十年ぶりの水準まで上がったのに、株はほとんど動いていない(特に米株)。危機なら、株はもっと落ちるはずです。
Government bond yields reached levels not seen in decades, yet equities barely moved, US equities in particular. If this were a crisis, stocks should have fallen a great deal further.
この記事では、この違和感の正体についてまとめます。使うのは米国財務省とFRB(米連邦準備制度理事会)、そして日本の財務省が公開している一次データだけです。専門用語は出てくるたびにその場で説明します。予備知識は要りません。
This article sets out what is behind that dissonance. We use only primary data published by the US Treasury, the Federal Reserve, and Japan's Ministry of Finance. Every technical term is explained where it first appears. No prior knowledge is required.
そもそも「長期金利」は誰が決めているのか
Who actually sets the long-term interest rate
最初に、いちばん誤解されている点から。長期金利※は中央銀行が決めている訳ではありません。
Let us start with the most misunderstood point of all. Long-term interest rates※ are not set by the central bank.
※ 長期金利とは、満期までの期間が長い国債※の利回り※のことで、一般には10年物国債の利回りを指します。住宅ローンや企業の長期借入の金利は、これを基準に決まります。
※ The long-term interest rate is the yield on a government bond with a long time to maturity, and generally refers to the 10-year government bond yield. Mortgage rates and long-term corporate borrowing costs are priced off it.
※ 国債とは、国が資金を借りるために発行する借用証書のことです。買った人は国にお金を貸し、決められた利息を受け取り、満期に元本が返ってきます。
※ A government bond is an IOU issued by a country in order to borrow money. The buyer lends to the state, receives a set rate of interest, and gets the principal back at maturity.
※ 利回りとは、その債券を今の価格で買って満期まで持った場合に、1年あたり何%で回るかを示した数字です。債券は価格が下がると利回りが上がり、価格が上がると利回りが下がる、シーソーの関係にあります。
※ Yield is the annualised percentage return you earn if you buy a bond at today's price and hold it to maturity. Bond prices and yields sit on a seesaw: when the price falls the yield rises, and when the price rises the yield falls.
中央銀行が直接動かせるのは、翌日返すような、ごく短い期間のお金の金利です。30年後に返ってくるお金の値段は、市場で国債を売り買いする人たちが決めます。だから「金利が上がった」というニュースは、正確には「国債を買う人たちが、より高い利回りを要求するようになった」という意味です。
What a central bank moves directly is the cost of very short-dated money, the kind repaid the next day. The price of money returned thirty years from now is set by the people buying and selling bonds in the market. So a headline saying "rates rose" means, precisely, that the people buying government bonds began demanding a higher yield.
ここが出発点です。金利上昇は、誰かが決めた政策ではなく、買い手の要求水準が動いた結果なのです。
That is the starting point. Rising yields are not a policy someone decided on. They are the result of a shift in what buyers demand.
教科書的分解: 長期金利は三つの部品でできている
The textbook breakdown: a long yield has three parts
長期金利は、ざっくり三つの部分の足し算だと説明されます。
A long-term yield is usually explained as the sum of roughly three components.
一つめは、これから何年かの政策金利の平均見通し。二つめは、期待インフレ率※。三つめは、タームプレミアム※です。
First, the expected average policy rate over the coming years. Second, expected inflation※. Third, the term premium※.
※ 期待インフレ率とは、市場参加者がこの先の物価上昇率をどれくらいと見込んでいるかを示す数字です。物価が上がると予想されるほど、貸し手は目減りを埋め合わせるために高い金利を求めます。
※ Expected inflation is the rate of future price increases that market participants anticipate. The more inflation they expect, the higher the interest rate lenders demand to offset the erosion of their money.
※ タームプレミアムとは、長期間お金を貸しっぱなしにする不確実性を引き受ける見返りとして、貸し手が上乗せで求める金利のことです。
※ The term premium is the extra yield lenders demand as compensation for bearing the uncertainty of lending money out for a long period of time.
そして、この三つを別の角度から二つに割ることもできます。名目金利※から期待インフレ率を引いたものが、実質金利※です。
Those three can also be cut a different way, into two. Subtract expected inflation from the nominal interest rate※ and what remains is the real interest rate※.
※ 名目金利とは、表面上の、そのまま表示されている金利のことです。
※ The nominal interest rate is the headline rate, the number as it is quoted.
※ 実質金利とは、名目金利から期待インフレ率を差し引いた、物価上昇分を除いた後に本当に手元に残る金利のことです。お金そのものを借りる値段、と考えると分かりやすくなります。
※ The real interest rate is the nominal rate minus expected inflation, meaning what genuinely remains once price increases are stripped out. It is easiest to think of it as the price of borrowing money itself.
なぜこの分解が重要かというと、同じ「金利上昇」でも中身が正反対の意味を持つからです。期待インフレ率が上がって金利が上がったなら、それは物価の話。実質金利が上がって金利が上がったなら、それはお金そのものが高くなったという話です。
This breakdown matters because the same words, "yields rose", can mean opposite things. If yields rose because expected inflation rose, the story is about prices. If yields rose because the real rate rose, the story is that money itself became more expensive.
幸い、この二つは分けて測れます。アメリカには物価連動国債(TIPS)※があるからです。
Fortunately the two can be measured separately, because the United States issues inflation-linked bonds, known as TIPS※.
※ TIPSとは、元本が物価に連動して増減する米国債のことです。普通の国債の利回りからTIPSの利回りを引くと、市場が織り込んでいる期待インフレ率が計算できます。この差はブレークイーブンとも呼ばれます。
※ TIPS are US Treasury bonds whose principal rises and falls with the price level. Subtracting the TIPS yield from the ordinary bond yield gives the inflation rate the market is pricing in. That gap is also called the breakeven rate.
測ってみると、答えは明らか
Measure it, and the answer is plain
実際に計算しました。2026年8月17日時点、アメリカの30年国債を使って分解した結果です。
We ran the calculation. Here is the US 30-year bond broken down as of 17 August 2026.
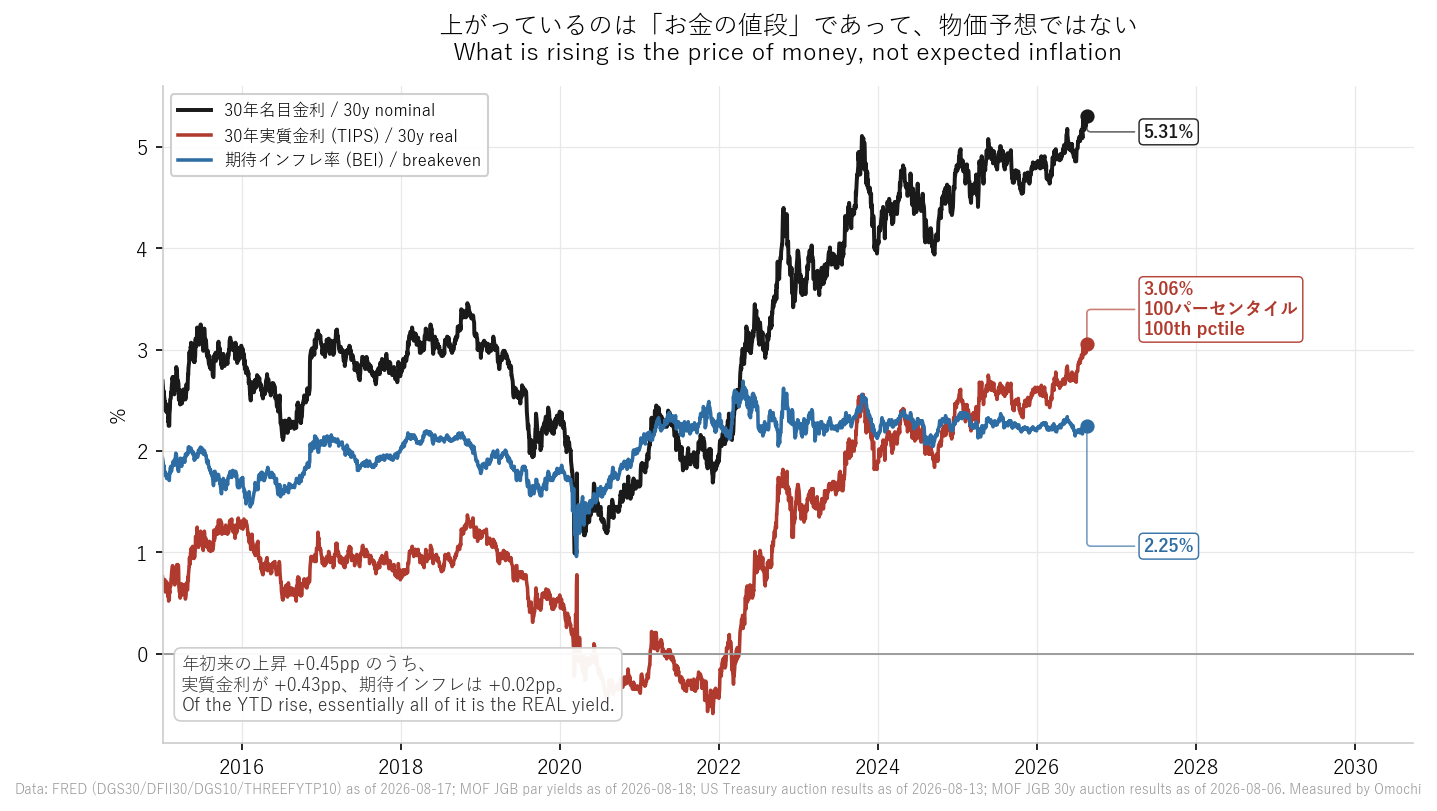
年初来の上昇+0.45%ポイントのうち、実質金利の上昇が+0.43%ポイント。期待インフレ率は+0.02%ポイントしか動いていません。
Of the +0.45 percentage point rise year to date, +0.43 points came from the real yield. Expected inflation moved by just +0.02 points.
内訳で見ると、名目5.31%は実質3.06%と期待インフレ2.25%に分かれます。つまり、上がっているのはほぼ全部が実質金利のほうです。市場は「これから物価が高騰する」と言っているのではありません。「お金そのものの値段が上がった」と言っているのです。
Broken out, the nominal 5.31% splits into a real yield of 3.06% and expected inflation of 2.25%. Almost the entire increase sits on the real side. The market is not saying that prices are about to surge. It is saying that money itself has become more expensive.
期間を変えても結論は変わりませんでした。1年で見ると実質+0.39%ポイントに対し期待インフレは-0.02%ポイント、5年で見ると実質+3.35%ポイントに対し期待インフレは+0.05%ポイントです。どの窓で切っても、動いているのは実質金利の側だけでした。
Changing the window does not change the conclusion. Over one year the real yield rose +0.39 points while expected inflation fell -0.02. Over five years the real yield rose +3.35 points against +0.05 for expected inflation. On every window we cut, the only thing moving is the real rate.
なお、30年の実質金利3.06%という水準は、この統計が始まった2010年以降で最も高い数字です。
For context, a 30-year real yield of 3.06% is the highest reading since this statistic began in 2010.
現金の奪い合いが起きている
There is a scramble for cash
物価予想が原因でないなら、何が原因か。ここで三つめの部品、タームプレミアムと、その背後にある需給の話になります。
If inflation expectations are not the cause, what is? This brings us to the third component, the term premium, and to the supply and demand sitting behind it.
教科書はタームプレミアムを「不確実性の対価」と説明します。でも実務的には、もっと単純な力学が働きます。国債を買うのに使えるお金の総量は無限ではない、という当たり前の話です。同じ財布を狙う借り手が増えれば、貸し手は強気になり、より高い利回りを要求できます。
Textbooks describe the term premium as the price of uncertainty. In practice a simpler force is also at work: the obvious fact that the pool of money available to buy bonds is not infinite. When more borrowers reach for the same wallet, lenders gain the upper hand and can demand a higher yield.
いま、その財布を誰が狙っているか。まず米国政府です。連邦債務は約40兆ドルに達しようとしており、発行※は増え続けています。
So who is reaching for that wallet? First, the US government. Federal debt is approaching roughly $40 trillion, and issuance※ keeps growing.
※ 発行とは、国や企業が新しく債券を売り出して資金を調達することです。発行が増えるほど、市場は多くの債券を消化しなければなりません。
※ Issuance is the act of a government or company selling new bonds to raise money. The more issuance there is, the more paper the market has to absorb.
そしてもう一つ、見落とされがちな借り手がいます。企業です。2026年の投資適格※社債の発行額は約2兆4600億ドルと予想されており、前年比で約11.8%の増加とされます。このうちAI・データセンター関連だけで3000億ドル超という試算もあります。
There is a second borrower that tends to get overlooked: companies. Investment-grade※ corporate bond issuance for 2026 is forecast at roughly $2.46 trillion, an increase of about 11.8% on the prior year. Some estimates put AI and data-centre related borrowing alone at more than $300 billion of that.
※ 投資適格とは、格付会社から一定以上の評価を受けた、信用力が高いとされる企業や債券のことです。
※ Investment grade describes companies or bonds rated above a certain threshold by the rating agencies, and therefore regarded as high credit quality.
国と企業が、同じ投資家の同じ資金を取り合っている。これがクラウディングアウト※と呼ばれる現象の入口です。
The state and the corporate sector are competing for the same money from the same investors. This is the entry point to what is called crowding out※.
※ クラウディングアウトとは、政府の資金調達が増えることで民間が使える資金が圧迫され、金利が押し上げられる現象のことです。
※ Crowding out is the phenomenon in which increased government borrowing squeezes the funds available to the private sector and pushes interest rates higher.
ここで結論を急がずにもう少し考える必要があります。もし本当に資金が枯渇しているなら、企業の信用スプレッド※は大きく広がるはずです。実際には、投資適格社債のスプレッドは約77ベーシスポイントと、金融危機前以来の狭さで推移していると報じられています。
Before jumping to a conclusion, it is worth pausing here. If money were genuinely running dry, corporate credit spreads※ ought to be widening sharply. In fact investment-grade spreads are reported to be running at roughly 77 basis points, about the tightest since before the financial crisis.
※ 信用スプレッドとは、企業が発行する社債の利回りと、同じ満期の国債の利回りの差のことです。企業の信用不安が高まるほど広がります。
※ A credit spread is the gap between the yield on a corporate bond and that of a government bond of the same maturity. It widens as concern about corporate creditworthiness increases.
つまり、これは信用不安ではありません。資金は足りていて、消化もされている。ただ、その資金を使わせてもらう値段が上がっただけです。この区別が、この記事のなかで最も重要な部分です。
So this is not a credit scare. The money is there and it is being absorbed. What has risen is simply the price of being allowed to use it. That distinction is the single most important point in this article.
米国の入札で確かめる。「誰も買わなくなった」は本当か
Testing it at the US auctions: has everyone really stopped buying?
ここまでは理屈です。では実際に、国債を買う人は減っているのでしょうか。これは推測しなくても確かめられます。米国債は入札※で売られ、その結果が全て公表されているからです。この章で見るのは米国債だけです。日本の入札は公表される項目そのものが違うので、あとで日本の指標を使って別に確かめます。
That was the theory. So are there actually fewer buyers for government bonds? We do not have to guess, because US Treasuries are sold at auction※ and every result is published. This section covers US Treasuries only. Japan publishes a different set of figures entirely, so we will test Japan separately, using Japan's own metrics.
※ 入札とは、国が新しく発行する国債を、投資家からの応札を集めて売る仕組みのことです。誰がどれだけ落札したかが毎回公表されます。
※ An auction is the mechanism by which a state sells newly issued government bonds, collecting bids from investors. Who won how much is published every time.
需要の強さを見るためにはいろいろな要素がありますが、入札者の構成が特にこの局面では重要だと見ます。
Several factors go into judging the strength of demand, but in this particular situation we regard the composition of the bidders as the most telling.
※ 応札倍率とは、募集額に対して何倍の応札が集まったかを示す数字です。高いほど買い手の関心が強かったことを意味します。
※ The bid-to-cover ratio shows how many times over the offered amount was bid for. A higher figure means stronger buyer interest.
※ プライマリーディーラーとは、国債の入札に参加する義務を負う指定業者のことです。売れ残りを引き受ける最後の買い手なので、この落札比率が高いときは「他に買う人がいなかった」というサインになります。
※ Primary dealers are designated firms obliged to participate in government bond auctions. They are the buyer of last resort for whatever goes unsold, so a high dealer share is a sign that nobody else showed up.
※ 間接入札者とは、ディーラーを経由して応札する投資家のことで、海外の中央銀行など外国勢の需要を測る代理指標として使われます。
※ Indirect bidders are investors who bid through a dealer. Their share is used as a proxy for foreign demand, including that of overseas central banks.
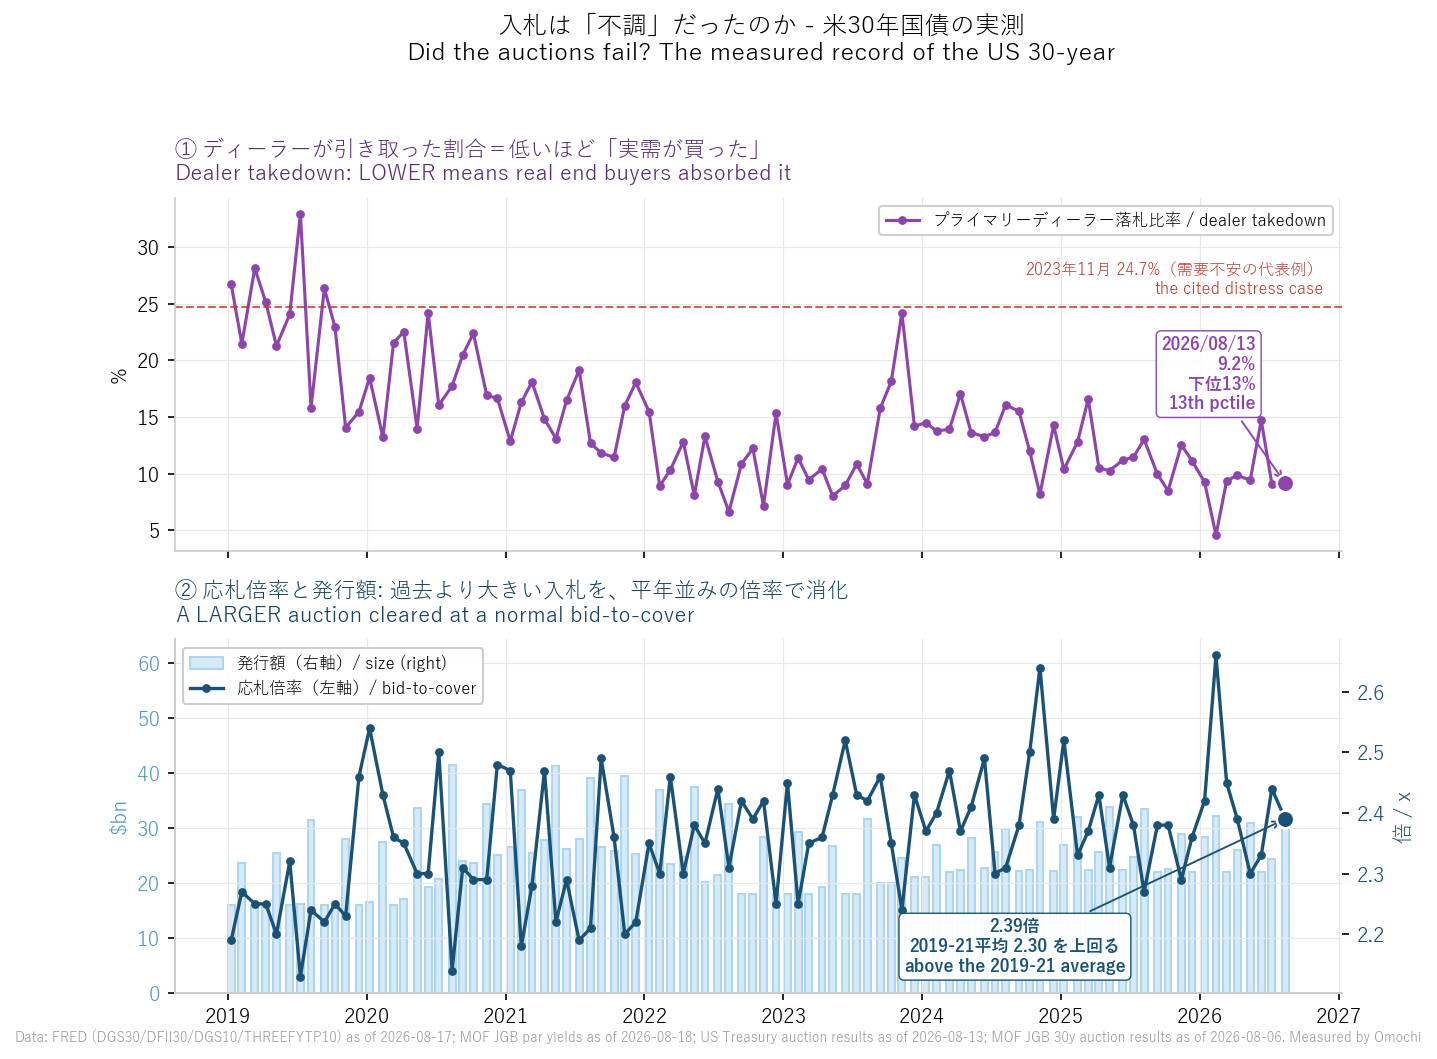
プライマリーディーラーの落札比率は、低いほど健全です。彼らは最後の受け皿なので、比率が高いということは実際の買い手が足りなかったことを意味します。実際、2023年11月の30年債入札でディーラーが24.7%を引き受けたときは、需要不安の代表例として語られました。
With the primary dealer share, lower is healthier. Because they are the backstop, a high share means there were not enough genuine buyers. When dealers took 24.7% of a 30-year auction in November 2023, it was widely cited as the textbook case of a demand scare.
では2026年8月13日の30年債入札はどうだったか。2019年以降の入札92回と並べて測りました。
So how did the 30-year auction of 13 August 2026 go? We measured it against all 92 auctions held since 2019.
| 指標 | 2026年8月13日 | 2019-21年平均 | 読み方 |
|---|---|---|---|
| 落札利回り | 5.216% | 該当なし | 買い手が要求した水準 |
| 応札倍率 | 2.39倍(92回中61パーセンタイル) | 2.30倍 | 平年並みかやや強い |
| ディーラー落札比率 | 9.2%(下位13%) | 18.9% | 低い=実需が買った |
| 間接入札者比率 | 53.1%(下位33%) | 54.0% | ここだけが弱い |
| 発行額 | 313億ドル | 251億ドル | 25%大きい入札 |
| Metric | 2026-08-13 | 2019-21 avg | How to read it |
|---|---|---|---|
| High yield | 5.216% | n/a | What buyers demanded |
| Bid-to-cover | 2.39x (61st pctile) | 2.30x | Normal to slightly strong |
| Dealer takedown | 9.2% (13th pctile) | 18.9% | Low means real buyers absorbed it |
| Indirect bidders | 53.1% (33rd pctile) | 54.0% | The one soft spot |
| Size | $31.3bn | $25.1bn | A 25% larger auction |
ディーラーの引き受けは9.2%。過去92回のうち下から13%に入る、極めて低い水準でした。しかも発行額は2019年から21年の平均より25%大きい。応札倍率も当時の平均を上回っています。
Dealers took 9.2%, which sits in the bottom 13% of those 92 auctions, an extremely low figure. And the auction was 25% larger than the 2019 to 2021 average, with a bid-to-cover ratio that also came in above the average of that period.
大きくなった入札を、平年並みの倍率で、しかも最後の受け皿にほとんど頼らずに消化した。これは不調な入札ではありません。
A bigger auction cleared at a normal bid-to-cover, and did so with almost no help from the backstop buyer. That is not a failed auction.
買い手は来ていたのです。ただ、より高い利回りを要求した。「誰も買わなくなった」と「買うけれど値段が上がった」は、まったく別の話です。
The buyers turned up. They simply demanded a higher yield. "Nobody is buying any more" and "they are buying, but the price has gone up" are entirely different statements.
ただし、正直に書いておくべき弱点が一つあります。間接入札者の比率は53.1%で、直近2024年から26年の平均59.2%を下回りました。外国勢の需要は、全体の需要が保たれる中で、じわりと薄くなっています。この点は次の章につながります。
There is one weak spot that should be stated honestly. The indirect bidder share came in at 53.1%, below the 59.2% average of 2024 to 2026. Foreign demand is thinning at the margin, even as total demand holds up. That point leads into the next section.
なお、入札の強弱を見るもう一つの目安に「テール」※があります。ただし米国財務省が公開しているデータには、これを計算するのに必要な数字が含まれていません。今回の入札にテールが出たとの報道はありますが、当社の実測ではないため参考にとどめます。逆に日本では、財務省がテールを計算できる形で公表しています。だから次の章では、日本については日本の指標で確かめます。
There is one further gauge of auction strength, known as the tail※. However, the data published by the US Treasury does not contain the figures needed to calculate it. There are reports that this auction produced a tail, but since that is not something we measured ourselves, we note it only for reference. Japan, by contrast, does publish its results in a form that allows the tail to be calculated. That is why the next section tests Japan using Japan's own metrics.
※ テールとは、入札で決まった平均価格と、最も低い落札価格との差のことです。差が大きいほど、弱気な札まで拾わないと売り切れなかったことを意味し、需要が弱かったサインとされます。
※ The tail is the gap between the average accepted price at an auction and the lowest accepted price. A wider gap means the sale could only be completed by reaching down to weaker bids, and is read as a sign of soft demand.
日本の30年は、同じ話を30年遅れでやっている
Japan's 30-year is running the same story, thirty years late
外国勢の需要が薄くなっている理由の一つが、日本にあります。
One of the reasons foreign demand is thinning lies in Japan.
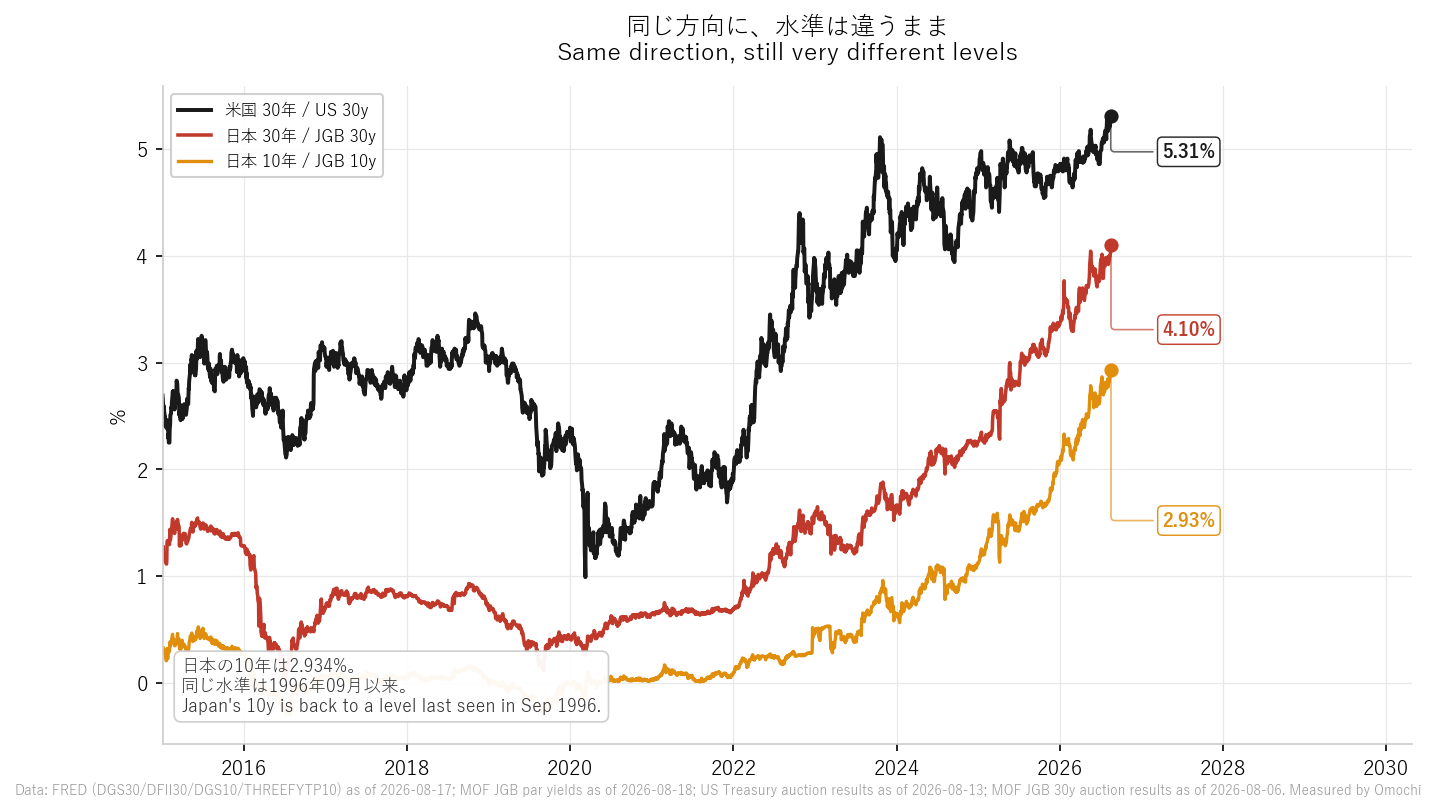
財務省の公表データで確認すると、2026年8月18日時点で日本の10年国債利回りは2.934%。この水準を最後に付けたのは1996年9月27日です。30年国債は4.096%、40年国債は4.103%でした。
According to data published by Japan's Ministry of Finance, as of 18 August 2026 the 10-year JGB yielded 2.934%. The last time it reached that level was 27 September 1996. The 30-year stood at 4.096% and the 40-year at 4.103%.
背景には日銀の政策転換があります。政策金利は2026年6月に1.00%まで引き上げられ、31年ぶりの高さになりました。
Behind this lies the Bank of Japan's change of policy. The policy rate was raised to 1.00% in June 2026, its highest in 31 years.
これがアメリカに跳ね返ります。日本の投資家は長年、国内で利回りが取れないために米国債を大量に買ってきました。国内金利が上がると、わざわざ為替リスクを取って米国債を持つ理由が薄れます。実際、日本の投資家は2026年1月から3月にかけて296億ドルの米国債を売り越したと報じられています。レパトリエーション※です。
This rebounds onto the United States. For years Japanese investors bought US Treasuries in size precisely because there was no yield to be had at home. Once domestic rates rise, the reason to take on currency risk for a US bond fades. Japanese investors are reported to have been net sellers of $29.6 billion of US debt between January and March 2026. This is repatriation※.
※ レパトリエーション(本国回帰)とは、海外に投資していた資金を自国の資産に戻す動きのことです。
※ Repatriation is the movement of money that had been invested abroad back into domestic assets.
では、日本の国債は買われなくなっているのでしょうか。ここで米国の数字を持ち出すことはできません。日米では、入札結果として公表される項目そのものが違うからです。
So have Japanese government bonds stopped being bought? We cannot answer that with the American figures, because the two countries publish genuinely different items in their auction results.
| 指標 | 米国債 | 日本国債 |
|---|---|---|
| 応札倍率 | 公表される | 公表される |
| ディーラー落札比率 | 公表される | 公表されない |
| 間接入札者比率 | 公表される | 公表されない |
| テール | 公表データからは計算不可 | 公表される |
| Metric | US Treasury | JGB (Japan) |
|---|---|---|
| Bid-to-cover | Published | Published |
| Dealer takedown | Published | Not published |
| Indirect bidders | Published | Not published |
| Tail | Not derivable from the public data | Published |
つまり、前の章で使ったディーラー落札比率という物差しは、日本には存在しません。その代わり日本には、米国では計算できないテールがあります。だから日本は日本の指標で見ます。
In other words, the dealer-share yardstick used in the previous section simply does not exist for Japan. What Japan has instead is the tail, which cannot be calculated for the US. So we judge Japan on Japan's own metrics.
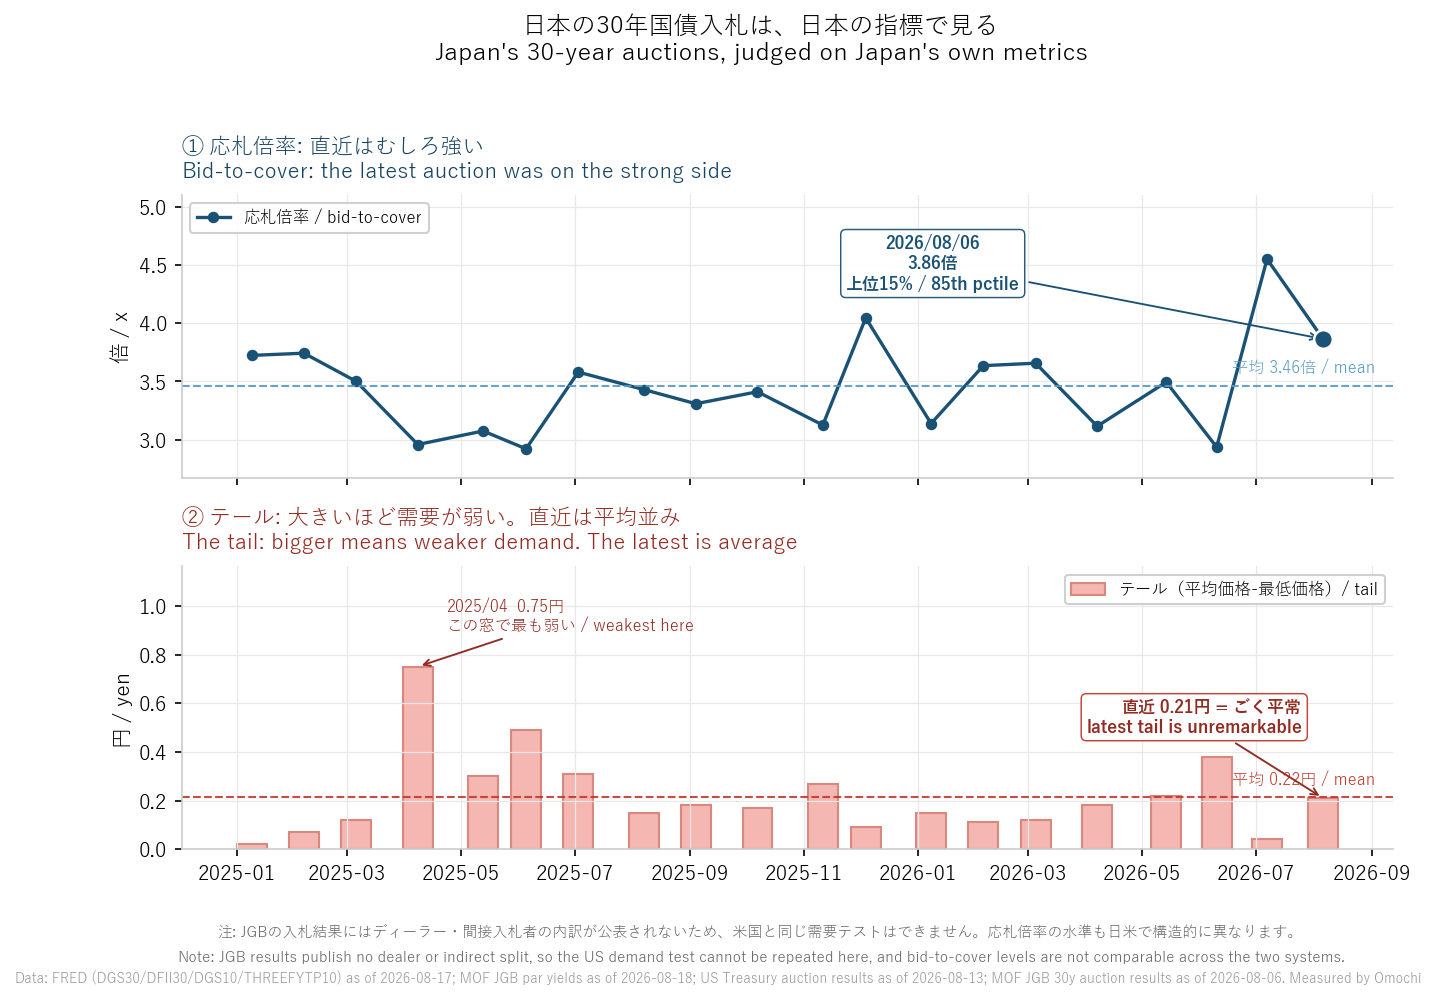
直近の2026年8月6日の30年債入札は、応札倍率3.86倍で、この20回のうち上位15%に入る強さでした。テールは0.21円で、平均の0.22円とほぼ同じです。この期間で最も弱かったのは2025年4月8日の入札(テール0.75円、応札倍率2.96倍)で、直近ではありません。
The most recent 30-year auction, on 6 August 2026, drew a bid-to-cover ratio of 3.86 times, placing it in the strongest 15% of those 20 auctions. The tail was 0.21 yen, essentially in line with the 0.22 yen average. The weakest auction in this period was that of 8 April 2025, with a tail of 0.75 yen and a bid-to-cover of 2.96 times, which is not recent.
つまり日本でも、長期金利が上がっているのは買い手が消えたからではありません。米国と同じ結論に、日本自身の数字で到達します。
So in Japan too, long yields are not rising because the buyers vanished. We reach the same conclusion as in the US, using Japan's own numbers.
ただし、ここで日米の応札倍率を並べて「日本のほうが需要が強い」と言うことはできません。日本の応札倍率はもともと3.5倍前後、米国は2.4倍前後で推移しており、入札制度の作りが違うためです。比べてよいのは、それぞれの国の過去の水準に対してだけです。
That said, we cannot put the two bid-to-cover ratios side by side and declare that Japanese demand is stronger. Japan's ratio runs at around 3.5 times and the US at around 2.4 because the two auction systems are built differently. The only valid comparison is against each country's own history.
最後に、前の章で唯一弱かった間接入札者の比率に戻ります。米国債を買う外国勢が薄くなっていることと、日本の金利が30年ぶりの水準まで上がっていることは、レパトリエーションという一本の線でつながっています。ただしこれは資金の流れの話であって、日本の入札結果から出てきた証拠ではありません。
Finally, back to the one soft spot from the previous section, the indirect bidder share. Thinning foreign demand for US Treasuries and Japanese yields at 30-year highs are connected by a single thread, namely repatriation. But that is a story about the flow of money, not evidence drawn from Japanese auction results.
なぜ株は落ちないのか。答えは「2027年」という期限にある
Why stocks are not falling: the answer is a deadline called 2027
ここまでで、金利が上がっている理由は分かりました。残るのは最初の違和感です。なぜ株はほとんど落ちないのか。
We now know why yields are rising. What remains is the dissonance we started with. Why have equities barely fallen?
答えは、多くの企業がまだ高い金利を払っていないからです。
The answer is that most companies are not yet paying the higher rate.
2020年から2021年にかけて、企業は歴史的な低金利で長期の借金を済ませました。当時の投資適格社債の利回りは2%から3%程度でした。市場金利が5%になっても、すでに借りたお金の利率は変わりません。借り換えの日が来るまでは、です。
Across 2020 and 2021, companies locked in long-term borrowing at historically low rates. Investment-grade yields at the time ran at roughly 2% to 3%. Even with market rates at 5%, the rate on money already borrowed does not change. Not, at least, until the day it has to be refinanced.
実際、いま企業が既存の社債に対して支払っている平均利率は、足元の市場金利より約1.5%ポイント低い水準にあるとされます。これが「株が落ちない理由」の正体です。市場は非合理なのではなく、期限つきの猶予を正しく価格に織り込んでいるだけです。
In fact the average rate companies currently pay on their existing bonds is reported to be about 1.5 percentage points below prevailing market rates. That is what is really behind stocks holding up. The market is not being irrational. It is correctly pricing a grace period that has an expiry date.
問題は、その猶予に終わりがあることです。S&Pグローバルによれば、借り換えが必要になる社債の額は2027年に1兆2600億ドルでピークを迎えます。2024年の9500億ドルから大きく増える計算です。
The problem is that the grace period ends. According to S&P Global, the volume of corporate debt requiring refinancing peaks in 2027 at $1.26 trillion, a substantial increase from $950 billion in 2024.
だから、この話の要点はこうなります。金利の「水準」はそれ自体では危機になりません。危機になるのは、誰かがその水準で借り直さなければならなくなった時です。見るべきなのは水準ではなく、カレンダーです。
Which brings us to the point of all this. A rate level is not, in itself, a crisis. It becomes one when somebody has to refinance at that level. The thing to watch is not the level, but the calendar.
出回っている説を、数字で確かめる
Checking the popular explanations against the numbers
最後に、いま語られている説をいくつか実測と突き合わせます。どれも広く見かける主張ですが、数字と合わないものが混じっています。
Finally, let us hold a few of the current explanations up against what we measured. All of them are widely repeated, and some of them do not match the data.
| よく聞く説 | 実測すると |
|---|---|
| インフレ懸念で長期金利が上がっている | 期待インフレ率は年初来+0.02%ポイント。上昇分のほぼ全ては実質金利 |
| タームプレミアムが異常に高い | 0.84。1990年以降で見ると55パーセンタイル=ごく平均的な水準 |
| 入札が不調で誰も国債を買わない | ディーラー引受9.2%は下位13%。25%大きい入札を実需が消化した |
| 日本の30年国債が史上最高 | 4.096%。ただし30年債の発行開始は1999年9月。それ以前との比較ではない |
| 金利が上がれば株は終わり | 当日のS&P500は0.3-0.5%安。多くの企業は借り換えまで低金利のまま |
| The popular claim | What the data shows |
|---|---|
| Inflation fears are driving long yields | Breakevens moved +0.02pp YTD. Nearly all of the rise is the real yield |
| The term premium is abnormally high | 0.84, the 55th percentile since 1990, an ordinary level |
| Auctions are failing; nobody wants Treasuries | Dealer takedown 9.2%, 13th pctile. A 25% larger auction was absorbed by real buyers |
| Japan's 30-year is at an all-time high | 4.096%, but the 30-year only began in September 1999 |
| Rising rates mean the end for equities | The S&P fell 0.3-0.5% that day. Most companies keep their old coupons until refinancing |
タームプレミアムについては補足が要ります。0.84という数字は2020年の底からは1.50%ポイント上がっており、「戻ってきている」のは事実です。ただし水準そのものは1990年以降の中央値付近であって、異常値ではありません。方向は正しく、程度は誇張されている、というのが実測から見た評価です。
The term premium needs a footnote of its own. At 0.84 it is indeed 1.50 percentage points above its 2020 trough, so it is fair to say it has been rebuilding. But the level itself sits near the median of its history since 1990, which is not an extreme reading. Measured against the data, the direction of the claim is right and the magnitude is overstated.
「債券自警団が政府を罰している」という表現もよく見かけます。これは判定を保留します。中央銀行が金利の経路を決めている以上その力は限定的だという反論も根強く、2025年に広く予想された長期債の暴落は結局起きませんでした。答えが出るのは、2027年の借り換えの山を市場がどう消化するかを見た後です。
You will also see the claim that bond vigilantes are punishing governments. On this we reserve judgement. There is a persistent counterargument that their power is limited so long as central banks set the path of rates, and the long-bond collapse widely predicted for 2025 never actually arrived. The answer will come only after we see how the market digests the 2027 refinancing peak.
編集部の見立て
Our take
今回の実測から言えることは、シンプルです。世界の長期金利上昇は、物価が暴れているからではなく、お金そのものの値段が上がったから起きています。そして買い手は逃げていません。より高い対価を求めているだけです。
What we measured supports a simple conclusion. The global rise in long-term yields is happening not because prices are running wild, but because money itself has become more expensive. And the buyers have not fled. They are simply asking to be paid more.
だから、日々の利回りの数字を追いかけてもあまり意味がありません。追うべきは日付のほうです。
Which means chasing the daily yield print is of little use. What deserves attention is the calendar.
| 見るべき時期 | 何を確認するか |
|---|---|
| 毎月の30年債入札 | ディーラー落札比率が15%を超え始めたら、需要の質が変わったサイン |
| 2026年9月の日銀会合 | 追加利上げがあれば、本国回帰と米国債への圧力が続く |
| 2027年 | 1兆2600億ドルの借り換えの山。企業の猶予が実際に切れる年 |
| What to watch | What it would tell you |
|---|---|
| Each monthly 30-year auction | Dealer takedown climbing above 15% would signal the quality of demand has changed |
| The BOJ's September 2026 meeting | Another hike keeps the repatriation channel, and the pressure on Treasuries, running |
| 2027 | The $1.26 trillion refinancing peak, when the corporate grace period actually expires |
いま起きているのは危機ではありません。ただし、安心してよいという話でもありません。正確に言えば、請求書の日付がまだ来ていないだけです。株式市場が落ち着いて見えるのは、その日付を知っているからであって、無視しているからではありません。
What is happening now is not a crisis. Nor, however, is it a reason to relax. Put precisely, the invoice has simply not yet come due. The equity market looks calm because it knows that date, not because it is ignoring it.
ところで、この「金利は上がっているのに、なぜ株は落ちないのか」という話、投資好きのビジネスマンとの飲み会で確実に盛り上がる話です。たいていは「そろそろ危ない」で終わってしまうところを、実質金利とディーラーの落札比率、そして2027年という期限というような少しこざかしい感じで話せる人はほぼいません。次の飲み会の肴にちょうどいい話題ではないでしょうか。そういう夜の店探しと予約は、Omochiにお任せください。
Incidentally, this question of why stocks are not falling when rates are rising is one that reliably gets going over drinks with business people who follow markets. Most of the time it ends at "feels like trouble ahead", and almost nobody can carry it a little further, in that faintly clever way, through the real yield, the dealer takedown ratio, and a deadline called 2027. It might be just the thing to bring out at your next dinner. Leave finding the place and booking it for evenings like that to Omochi.