キオクシア急騰と「靴磨き少年」の逸話、本当に当たるのか?
Kioxia's Surge and the "Shoeshine Boy" Parable — Does It Actually Predict Tops?
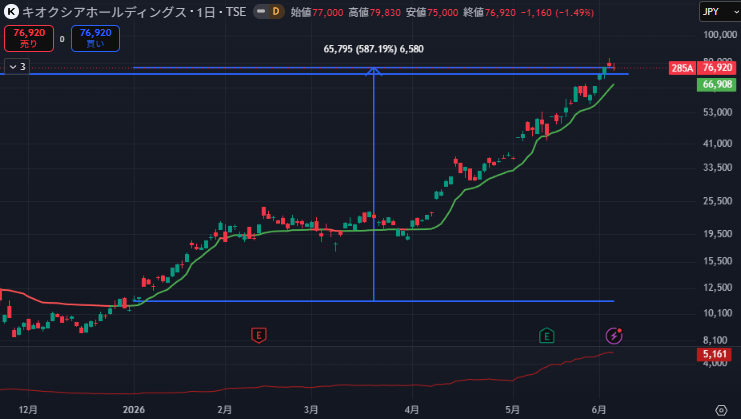
2026年、東証プライム市場で売買代金が断トツの銘柄、キオクシアホールディングス。2024年12月の公募価格1,455円から、2026年5月7日には終値43,410円、6月5日時点では76,920円。1年半で約50倍に到達しました。時価総額は東証時価総額トップ3に入っています。
In 2026, the single most actively traded stock on the Tokyo Stock Exchange Prime Market is Kioxia Holdings. From its December 2024 IPO price of ¥1,455 to a close of ¥43,410 on May 7, 2026, and reaching ¥76,920 by June 5 — roughly a 50x increase in 18 months. The market cap puts Kioxia among the top three on the TSE by market capitalization.
年初来の上昇率は2026年5月7日時点で660%超、6月5日時点ではさらに加速しています。世界で最も上昇した半導体メーカーです。
Year-to-date, the stock was up over 660% as of May 7, 2026 — and the pace has accelerated further through June 5. The best-performing semiconductor maker in the world.
これだけの急騰、SNSでの個人投資家の話題化、を見ると、誰もが思い出す古い逸話があります。
A rally of this scale, combined with the level of retail-investor chatter on social media, brings to mind an old anecdote that almost everyone in finance has heard.
「靴磨き少年が株の話を始めたら、もう売り時」
"When the shoeshine boy starts talking stocks, it's time to sell."
この元ネタはたどるとジョー・ケネディ(JFKの父)が1929年の米国の株式市場大暴落の直前、靴磨き少年から株のアドバイスを受けて全株を処分した、と言われています。今のSNSや巷の反応を見ればこの逸話に乗るなら、キオクシアは今すぐ売るべき、ということになります。
The source traces back to Joe Kennedy (JFK's father), who is said to have liquidated his entire stock portfolio just before the 1929 US market crash after receiving stock tips from a shoeshine boy. Going by the current social-media chatter, if you follow this parable, Kioxia should be sold immediately.
ただ、ここで一度立ち止まってみましょう。
But let's pause here for a moment.
この逸話、本当に過去の市場で正確だったのでしょうか。実は、データを並べてみると、結果はかなり違う方向を示しています。
This parable — has it actually been accurate in past markets? When you lay out the data, the results point in a notably different direction.
まず、逸話の出どころ自体が怪しい
First: The Parable's Own Provenance Is Shaky
「靴磨き少年」の話はあまりに有名で、ほぼ事実として扱われていますが、実はジョー・ケネディが本当にこの理由で株を売ったかは、歴史的に確認されていません。
The shoeshine boy story is so famous that it's effectively treated as fact. But whether Joe Kennedy actually exited the market for this reason has never been historically confirmed.
CNBCの2013年の検証記事では、この話を「半ば伝説(apocryphal)」と表記し、ケネディの実際の市場退出理由ではない可能性が高い、としています。同時期のバーナード・バルーク※の回想録には、「タクシー運転手が銘柄を語り、靴磨き少年が金融ニュースを要約し、街頭の物乞いまでが株のヒントをくれた」という記述が残っていますが、これも具体的な売却タイミングとの因果関係は示されていません。
CNBC's 2013 retrospective explicitly labels the story "apocryphal," and concludes that it is most likely not Kennedy's actual rationale for exiting. Bernard Baruch※, a contemporary of Kennedy's, did leave a memoir passage describing "taxi drivers calling out stock picks, shoeshine boys summarizing the day's financial news, and even street beggars offering stock tips" — but even this account establishes no causal link between such observations and any specific sell decision.
※ バーナード・バルーク(Bernard Baruch、1870-1965)は、20世紀前半の米国を代表する投資家・政府顧問。1929年の暴落前に大幅にポジションを縮小したとされる人物の一人で、ジョー・ケネディと並んで「靴磨き少年」逸話の文脈で引用される。
※ Bernard Baruch (1870-1965) was one of America's most prominent early-20th-century investors and presidential advisers. He is one of the figures said to have substantially reduced his positions ahead of the 1929 crash, and is frequently cited alongside Joe Kennedy in the context of the shoeshine boy parable.
CNBC — Is the shoeshine boy indicator flashing red?
つまり、私たちが「教訓」として共有しているこの逸話は、出所自体が不確かな状態で受け継がれてきた、というのが第一の事実です。
In other words, the very anecdote we share as a "lesson" has been passed down with its origin itself uncertain. That's fact number one.
歴史を並べてみると、見えてくるパターン
The Pattern That Emerges When You Lay Out the History
ここからが本題です。「個人投資家が群がり始めたら売り」という信号を、過去の主要バブル局面で実際に使っていたらどうなったか。
Here's the heart of the argument. If you had actually used the "retail investors are piling in, sell" signal in past major bubble episodes, what would have happened?
ニューヨーク大学Stern School of BusinessのAswath Damodaran教授※は、著書「Investment Fables」(投資の寓話)の第14章で、市場タイミング指標を体系的に検証しています。結論として、「個人投資家の参加拡大」は方向性を示すことはあっても、ピークを当てる指標としては機能しない、と論じています。
Professor Aswath Damodaran※ of NYU Stern School of Business systematically examines market timing indicators in Chapter 14 of his book "Investment Fables." His conclusion: "broader retail investor participation" may indicate directionality, but does not function as a tool for calling tops.
※ Aswath Damodaran教授は、ニューヨーク大学Stern School of Businessの財務学教授。株価評価理論の世界的権威で、機関投資家向けの教科書として「Investment Valuation」が30年以上使われている。「Investment Fables」は市場で広く信じられている定説を、データで検証する内容。
※ Aswath Damodaran is a Professor of Finance at NYU Stern School of Business and a global authority on valuation theory. His textbook "Investment Valuation" has been a standard reference for institutional investors for over 30 years. "Investment Fables" is dedicated to empirically testing widely-believed market maxims against the data.
Damodaran — Investment Fables Chapter 14
具体的にいくつかの事例を見ます。
Let's examine specific cases.
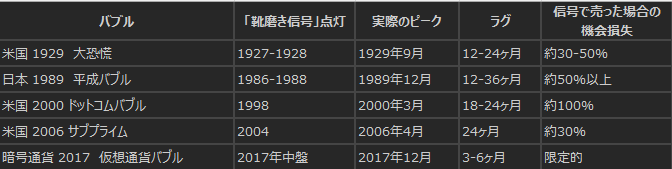
日本、1989年バブル:日経平均は1989年12月29日に38,915.87円でピークを付けました。ただし、ピーターソン国際経済研究所のAdam Posen※論文によれば、日本の個人投資家は「ピーク後も2年間、投資を続けた」と記録されています。逆算すると、退場すべきタイミングとして語られる1986〜1988年に「靴磨き少年信号」で売っていた場合、ピークまでの1〜3年分(指数で言えば50%以上)の上昇を取り逃がしたことになります。
Japan, 1989 Bubble: The Nikkei 225 peaked at 38,915.87 on December 29, 1989. However, according to a Peterson Institute for International Economics paper by Adam Posen※, Japanese retail investors "continued investing for two years even after the peak." Working backwards, if you had sold on the "shoeshine boy signal" during the 1986-1988 window — the period commonly cited as the right time to exit — you would have missed 1 to 3 years of further gains, equivalent to over 50% of additional upside on the index.
※ Adam S. Posenは、ピーターソン国際経済研究所(PIIE)所長。日本の金融政策と資産バブルに関する研究で世界的に知られる。論文「It Takes More than a Bubble to Become Japan」は、日本のバブル後の投資家行動を実証的に分析した代表的研究。
※ Adam S. Posen is President of the Peterson Institute for International Economics (PIIE) and is internationally known for research on Japanese monetary policy and asset bubbles. His paper "It Takes More than a Bubble to Become Japan" is one of the most-cited empirical analyses of post-bubble Japanese investor behavior.
Peterson Institute — Adam Posen WP 03-9
米国、2000年ドットコムバブル:ナスダックは2000年3月10日に5,048でピーク。NBER(米国経済研究所)のOfek-Richardson論文※は、個人投資家のインターネット株への集中が1998年時点で既に観察されていたと分析。「郵便配達員や美容師がIT銘柄を話す」現象は1998年の現象であり、ピークまでなお約2年。
US, 2000 Dot-com Bubble: The Nasdaq peaked at 5,048 on March 10, 2000. The Ofek-Richardson NBER paper※ documents that retail investor concentration in internet stocks was already observable by 1998. The phenomenon of "mail carriers and hairdressers discussing tech tickers" was a 1998 phenomenon — with roughly two years still to go before the peak.
※ Eli OfekとMatthew Richardsonによる「DotCom Mania」(NBER Working Paper 8630)は、ドットコム期の個人投資家行動を実証分析した最も引用される論文の一つ。データは1998-2000年の取引データを使用。
※ "DotCom Mania" (NBER Working Paper 8630) by Eli Ofek and Matthew Richardson is one of the most-cited empirical analyses of retail investor behavior during the dot-com era. The paper draws on trading data spanning 1998-2000.
NBER — DotCom Mania (Ofek and Richardson)
米国、2006年住宅バブル:S&P/ケース・シラー全米住宅価格指数は2006年4月にピーク。個人投資家による「住宅転売(house flipping)」ブームが顕著だったのは2004年。ピークまでなお約2年。
US, 2006 Housing Bubble: The S&P/Case-Shiller National Home Price Index peaked in April 2006. The "house flipping" boom driven by retail investors was most visible in 2004 — again, with roughly two years still to run before the peak.
これらを並べてみると、共通するパターンが見えます。「靴磨き少年が動いた時期」と「実際のピーク」の間には、平均で1〜3年のラグがある。そして、金融市場で1〜3年の判断ミスというのは、要するに、間違っている、ということです。
When you line these up, a common pattern emerges. The lag between "when the shoeshine boy moved" and "the actual peak" averages 1 to 3 years. And in financial markets, being 1 to 3 years off is, plainly, just being wrong.
なぜラグが発生するのか — 構造的な理由
Why the Lag Happens — Structural Reasons
論理的にも整理できます。
The logic can be laid out cleanly.
個人投資家が「市場の話題」として参入する時点で、既にメディアが取り上げ始めています。メディア露出は通常、トレンドが顕在化してから半年〜1年で本格化します。さらに、本物のバブル局面では、機関投資家の追従買い、企業の自社株買い、年金基金のアロケーション変更、などの「後追い需要」が、個人投資家の参入後も2〜3年継続するのが標準的なパターンです。
By the time retail investors enter as part of "the market conversation," media coverage is already underway. Media coverage typically takes 6 to 12 months to ramp up after a trend becomes visible. On top of that, in genuine bubble phases, "follow-on demand" — institutional buying, corporate share buybacks, pension fund allocation shifts — typically continues for 2 to 3 years after retail investors first enter.
つまり、靴磨き少年が動いた時には、まだ「需要のもう一段」が控えている、というのが過去の事例の標準的な顔つきです。
In other words, by the time the shoeshine boy is moving, there is still "one more layer of demand" waiting in the wings. That's the standard shape of past episodes.
ここで、一つあえて反論するとすると。
Here, if we deliberately steel-man a counterargument:
「結局、ピークの後に下落するなら、早く売っても問題ないのでは?」
"If the price falls after the peak anyway, doesn't it not matter that you sold early?"
これは数字で見るとそうではありません。1989年の日経平均で言えば、靴磨き少年信号が点灯したとされる1986年(25,000円付近)で売っていた場合と、ピークの38,900円で売っていた場合では、約55%のリターン差があります。仮に「下落分も全部正確に予測した」としても、その期間中に他の銘柄への再投資ができていなければ、機会損失が発生しています。
The numbers say otherwise. For the Nikkei 225, selling in 1986 (around 25,000) — when the shoeshine boy signal is said to have flashed — versus selling at the peak of 38,900 implies a return gap of roughly 55%. Even if you had perfectly predicted the subsequent decline, you would still incur an opportunity cost during that intervening period unless you reinvested perfectly in something else.
逆に言えば、指標として方向は当たっていても、タイミング精度の悪さが致命的、というのが過去の事例の教訓です。
Put differently, the indicator may be directionally correct, but its timing precision is fatal — that's the lesson the historical cases teach.
では、キオクシアはどう見るべきか
So How Should We Read Kioxia?
ここまでの整理を踏まえて、現在のキオクシアの状況を構造的に見ます。
With the framework above in place, let's structurally examine Kioxia's current situation.
実体面(強気要因):2026年1〜3月期の売上高は前年同期比189%増の1兆29億円、営業利益は15倍の5,968億円。AIデータセンター向けNAND型フラッシュメモリ※の需要が爆発的に拡大している一方、供給側は新規生産能力が「早くても2027年後半」までオンラインに乗らない、という供給制約があります。価格決定力(プライシングパワー)は完全にメモリメーカー側にあります。
Fundamentals (the bull case): Q1 (Jan-Mar 2026) revenue came in at ¥1.0029 trillion, up 189% year-over-year. Operating profit jumped 15-fold to ¥596.8 billion. NAND flash memory※ demand for AI data centers is exploding, while new production capacity on the supply side won't come online until "late 2027 at the earliest." Pricing power sits squarely with the memory makers.
※ NAND型フラッシュメモリは、SSDの主要構成部品となるストレージ半導体。キオクシア(旧東芝メモリ)、Samsung、SK Hynix、Micron、SanDiskの5社で世界シェアの大半を占める寡占市場。AI向けデータセンターのストレージ需要が、2024-2026年で構造的に急増中。
※ NAND flash memory is the storage semiconductor that forms the core component of SSDs. The global market is an oligopoly dominated by five companies — Kioxia (the former Toshiba Memory), Samsung, SK Hynix, Micron, and SanDisk. AI data center storage demand has structurally surged from 2024 through 2026.
TrendForce — Kioxia 48-fold Q1 profit jump
バリュエーション面(弱気要因):トレーリングPERは約77倍、PBRは30.2倍※。アナリスト14名の目標株価は17,000円〜80,000円と約5倍のレンジ。これは、市場が「キオクシアの今後の収益持続性」について、コンセンサスを作れていないことを示しています。
Valuation (the bear case): The trailing P/E is roughly 77x and the P/B is 30.2x※. Analyst price targets from 14 analysts range from ¥17,000 to ¥80,000 — a 5x spread. This indicates the market has not formed a consensus on "the sustainability of Kioxia's future earnings."
※ PER(株価収益率)は、株価が1株あたり利益の何倍かを示す指標。日本市場の平均は15-20倍程度。PER 77倍は、市場が「今後数年間、現在の利益水準の数倍の成長」を織り込んでいる状態。PBR(株価純資産倍率)30倍は、純資産価値の30倍で取引されている状態。
※ P/E (Price-to-Earnings Ratio) shows how many times the per-share earnings the stock price represents. The average for the Japanese market is roughly 15-20x. A P/E of 77x implies the market has priced in "several times the current earnings level over the next few years." A P/B of 30x means the stock trades at 30 times its book value.
構造的な論点:NAND型フラッシュメモリは、歴史的にサイクル性の強いコモディティです。半導体サイクル※の過去パターンを見ると、需給逼迫から供給過剰への転換は、新工場稼働後12〜18ヶ月で発生するのが標準的。キオクシアの場合、新規生産能力が2027年後半にオンライン化すると、2028年中には市況が反転する蓋然性が高い、という構造です。
The structural point: NAND flash memory is historically a strongly cyclical commodity. Looking at past patterns of the semiconductor cycle※, the shift from tight supply to oversupply typically occurs 12 to 18 months after new factory capacity comes online. For Kioxia, with new capacity ramping in late 2027, market conditions are structurally likely to reverse during 2028.
※ 半導体サイクルは、半導体業界に固有の需給変動パターン。設備投資から実生産までのリードタイムが18-24ヶ月と長いため、需要拡大期に投資が集中し、その2年後に供給過剰が発生する、という波を繰り返す。NAND、DRAM、ロジック半導体それぞれで独立したサイクルが存在。
※ The semiconductor cycle is the supply-demand fluctuation pattern unique to the semiconductor industry. Because the lead time from capital investment to actual production is long — typically 18 to 24 months — investment clusters during demand expansion phases, producing oversupply two years later. NAND, DRAM, and logic semiconductors each have their own independent cycles.
結論 — 靴磨き少年の話は、要するに
Conclusion — The Shoeshine Boy Story, In Short
ここまでの分析を整理すると、結論は2段階で出ます。
Organizing the analysis above, the conclusion comes in two stages.
第一に、「靴磨き少年信号」を理由にキオクシアを今売る、という判断は、過去の事例パターンを踏まえると、合理性が低い可能性があります。歴史的にこの信号は、ピークの1〜3年前に点灯します。
First: the judgment "sell Kioxia now because of the shoeshine boy signal" carries low rationality when you factor in past case patterns. Historically, this signal fires 1 to 3 years before the peak.
第二に、ただし、キオクシアのバリュエーションがサイクル性のあるコモディティビジネスにしては高い、という別の論点は実在します。これは「靴磨き少年」とは無関係の、構造的な論点です。NAND相場が2028年に反転すれば、PER 77倍の前提は崩れます。
Second: that said, the separate argument that Kioxia's valuation is high for a cyclical commodity business does genuinely exist. This is a structural point that has nothing to do with the shoeshine boy parable. If the NAND market reverses in 2028, the P/E 77x premise falls apart.
つまり、売り判断をするなら、根拠は靴磨き少年の話ではなく、NAND相場のサイクル転換時期を見るのが筋です。
In other words, if you are going to make a sell decision, the grounds should not be the shoeshine boy parable but rather the timing of the NAND market's cyclical reversal.
投資家として、本当に監視すべき指標
What Investors Should Actually Monitor
「靴磨き少年信号」よりも、過去のデータで予測力が高い指標を3つ挙げます。
Here are three indicators that, based on historical data, have higher predictive power than the "shoeshine boy signal."
第一に、NANDスポット価格の前週比トレンド。需給逼迫から需給緩和への転換は、スポット価格に2-3ヶ月先行して現れます。月次の市況レポート(DRAMeXchange、TrendForceなど)が無料で公開されています。
First: the week-over-week trend in NAND spot prices. The shift from tight supply to easing demand-supply balance appears in spot prices 2 to 3 months ahead. Monthly market reports (DRAMeXchange, TrendForce, etc.) are publicly available for free.
第二に、合弁パートナーのSanDisk決算※。キオクシアとSanDiskは生産能力を共同保有しているため、SanDiskの四半期決算で見えるASP(平均販売単価)の動向は、キオクシアの先行指標として機能します。
Second: the earnings of its joint-venture partner SanDisk※. Because Kioxia and SanDisk share production capacity, the ASP (Average Selling Price) movements visible in SanDisk's quarterly earnings function as a leading indicator for Kioxia.
※ SanDiskは、米国Western Digital社のメモリ事業部門が2025年に独立した会社。キオクシアと長年の合弁関係にあり、生産工場(四日市、北上)を共同運用している。NAND相場の先行指標として、毎四半期の決算が市場で注目される。
※ SanDisk became an independent company in 2025 when it was spun off from Western Digital's memory business. It has a longstanding joint-venture relationship with Kioxia and jointly operates production facilities in Yokkaichi and Kitakami, Japan. Its quarterly earnings are closely watched as a leading indicator for the NAND market.
第三に、アナリスト目標株価の幅の収束。現在17,000円〜80,000円という5倍レンジは、市場のコンセンサス不在を示します。このレンジが3倍以下まで縮小したタイミングが、「市場の判断が出た」シグナルです。
Third: the convergence of analyst price target ranges. The current ¥17,000-¥80,000 (5x) spread indicates the absence of market consensus. The moment this range narrows to 3x or less is the signal that "the market has reached a verdict."
まとめ
In Summary
「靴磨き少年が株を語り始めたら売り」というフレーズは、強力で、覚えやすく、そしてSNSで引用しやすい。ですが、歴史を実際にデータで並べてみると、信号としての精度は、私たちが思っているほど高くありません。
The phrase "sell when the shoeshine boy starts talking stocks" is powerful, memorable, and easy to quote on social media. But when you actually lay out the historical data, its precision as a signal is not as high as we tend to believe.
キオクシアを売るか持つかの判断は、靴磨き少年の話ではなく、NANDサイクルの構造分析に基づくべき、というのが現時点の読みです。
The decision of whether to sell or hold Kioxia should be based on structural analysis of the NAND cycle, not the shoeshine boy parable — that's the read as it stands.
過去の前例の検証、現在のキオクシアの構造的な強弱、そして本当に監視すべき3つの先行指標まで整理しました。
We've laid out the historical record check, Kioxia's current structural strengths and weaknesses, and the three leading indicators worth actually monitoring.
1年半で30倍の話、ビジネスディナーの場で取り上げるには贅沢すぎるトピックです。話の場所探しは、僕らのアプリにお任せください。
A 30x rally in 18 months — a topic almost extravagant for a business dinner. Leave the venue search to our app.